Skip to content
Sign In Try Free
Workflow-specific products Content, decks, briefs, proposals, legal, and sales each have a clearer buying path.
Review before delivery Draft, edit, collaborate, approve, and export in the same workspace.
Security + procurement path Security policy, support, and Azure Marketplace buying are public.
Gixo Prism · business visual communication

Create exact, on-brand visuals from your data or text.

Deterministic makers preserve the labels and values you supply; AI infographics and visual packs stay clearly reviewable before publication.

Exact data and text On-brand by construction Ready for decks and docs
Your sourceQ4 revenueQ1 120 · Q2 180 · Q3 155 · Q4 240
Prism renderNumbers stay right.Rendered, not redrawn.
Why Prism exists

Business visuals need more than a pretty image.

Image generators

Can make an attractive visual, but may approximate the text, numbers, and structure.

Prism

Renders structured visuals deterministically, so the information stays accurate and reusable.

Built for work where the visual has to be right
01Exact numbers and labels
02Consistent brand treatment
03Reusable in decks, docs, and proposals
See the difference

From business input to a visual you can trust.

Switch between examples to see how Prism turns structured information into a clean, reusable visual. The content stays readable because it is rendered as structure, not painted as pixels.

INPUTQuarterly revenueQ1 120 · Q2 180 · Q3 155 · Q4 240
Q4 revenueRendered SVG
120180155240
Q1Q2Q3Q4
Examples, not promises

See the kinds of visuals Prism is built to make.

Open the full gallery →
Built for accountable communication

The visual stays useful after it leaves Prism.

Prism is designed for work that gets reviewed, edited, exported, and reused—not just admired in a feed.

Deterministic renderingNumbers and labels are rendered from your structured input.
Brand consistencyThe same palette and style rules carry across every visual.
Reviewable outputExport clean visuals for the documents and decks your team already uses.
Clear ownershipStart from your data, your source, and your chosen structure.
Product fit

Is Prism right for you?

Best for

You need charts, diagrams, flowcharts, or cards rendered deterministically from structured labels and values, or separately reviewed generative visual assets.

Not the right fit when

You need a generative image or infographic to guarantee exact text, exact numbers, source-data correctness, or native editability.

What to expect

Prism's chart, diagram, flowchart, and card makers render structured input deterministically, preserving the labels and values supplied by the user.

What your team should review

Confirm that the source data is correct, and separately inspect all text, numbers, and visual details in generative infographics and visual packs.

Important limitation

AI infographics and visual packs are generative image outputs. Review their text, numbers, and visual details before use; they do not carry the exactness guarantee of Prism's deterministic makers.

Deterministic visual communication for exact charts, diagrams, and decks

Infographics, charts, diagrams, flowcharts, cards, and visual packs - rendered for exact labels and reusable brand styling.

Best fit For marketers and operators who need exact charts, diagrams, infographics, and visual packs.
Start path Start with deterministic makers for exact charts and diagrams, or move into the visual creation flow for richer assets.
Trial or free path Prism separates deterministic free tools from paid visual generation, packs, and plan-based production paths.
Paid unlock Paid Prism unlocks richer visual generation, packs, brand production, and plan-based asset workflows.

Starter

For one person creating exact, on-brand visuals

Best for one person doing real work

$10/month


Infographics, charts, diagrams, flowcharts, and cards

Deterministic makers preserve supplied labels and values

Visual Packs of coordinated on-brand images

Export to HTML, SVG, PNG, PDF, and PPTX

14-day free trial, then one simple plan

Business

Good for teams

Shared workflows, brand control, and admin setup

$45/month


Enterprise

For larger teams and custom setup

Security review, procurement, and private offers

$99/month


Prism separates 4 deterministic maker families covering 16 chart types, 11 diagram shapes, 2 flowchart modes, and 4 card types from paid infographic generation, visual packs, and brand-governed production paths. Export maker visuals as HTML, SVG, PNG, PDF, and PPTX, with PPTX arriving as native, selectable PowerPoint shapes; export infographics as PNG and HTML; and download visual packs as PNG, JPG, and WebP. Saved visuals can pull from public, read-only Google Sheets, Excel Online, CSV, and JSON sources you can refresh on demand, with staleness flags when the source moves on, carry a deterministic accessibility preflight - automatic WCAG AA contrast repair, a color-vision-safe palette, alt text, reading order, and chart data tables - that flags publish-blocking issues before handoff, and support live editing presence, comments, review threads, and version history, plus one-click publishing to a stable, revocable public link with time-limited guest-review invitations.

Public deterministic tools
Build and preview exact visuals before signup

The chart, diagram, flowchart, and card makers below render and preview without an account. Badged HTML and SVG copies remain available without a plan; clean copy plus PNG, PDF, and PPTX exports require an active Prism trial or plan. AI infographics and Visual Packs use the paid generation path.

Start the 14-day trial
One visual system, many business moments

Use Prism where decisions need to become clear.

Ready for the next surface

Create once. Reuse everywhere the work gets discussed.

SVG and HTML for deterministic makersPNG and HTML for AI infographicsInline visuals for articles, briefs, and decks
Fits the work you already do

Bring Prism into the places your team communicates.

Ready when the visual needs to be right

Make your first exact visual.

Start with a free maker, then bring the same structure into your broader Prism workflow.

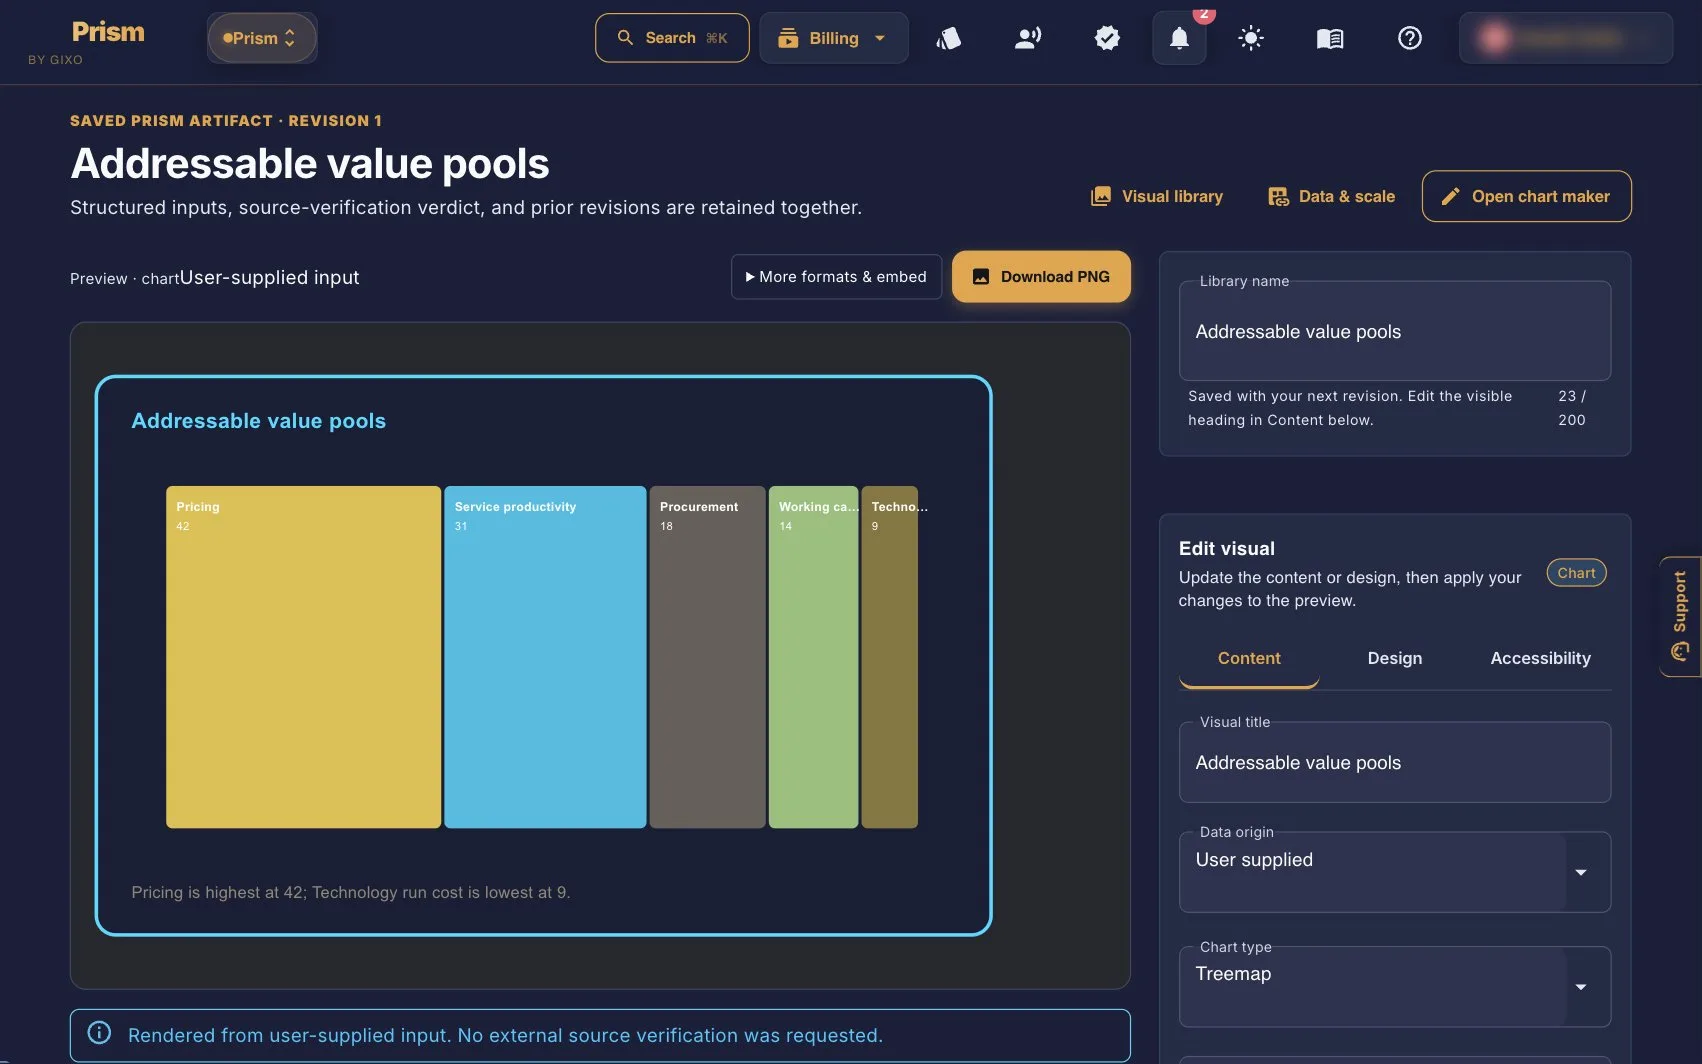
Current Prism editor showing an Addressable value pools chart with exact labels, content fields, and Download PNG
The current Prism editor: structured input on the right, exact labels on the visual, and a source-verification note before you export.
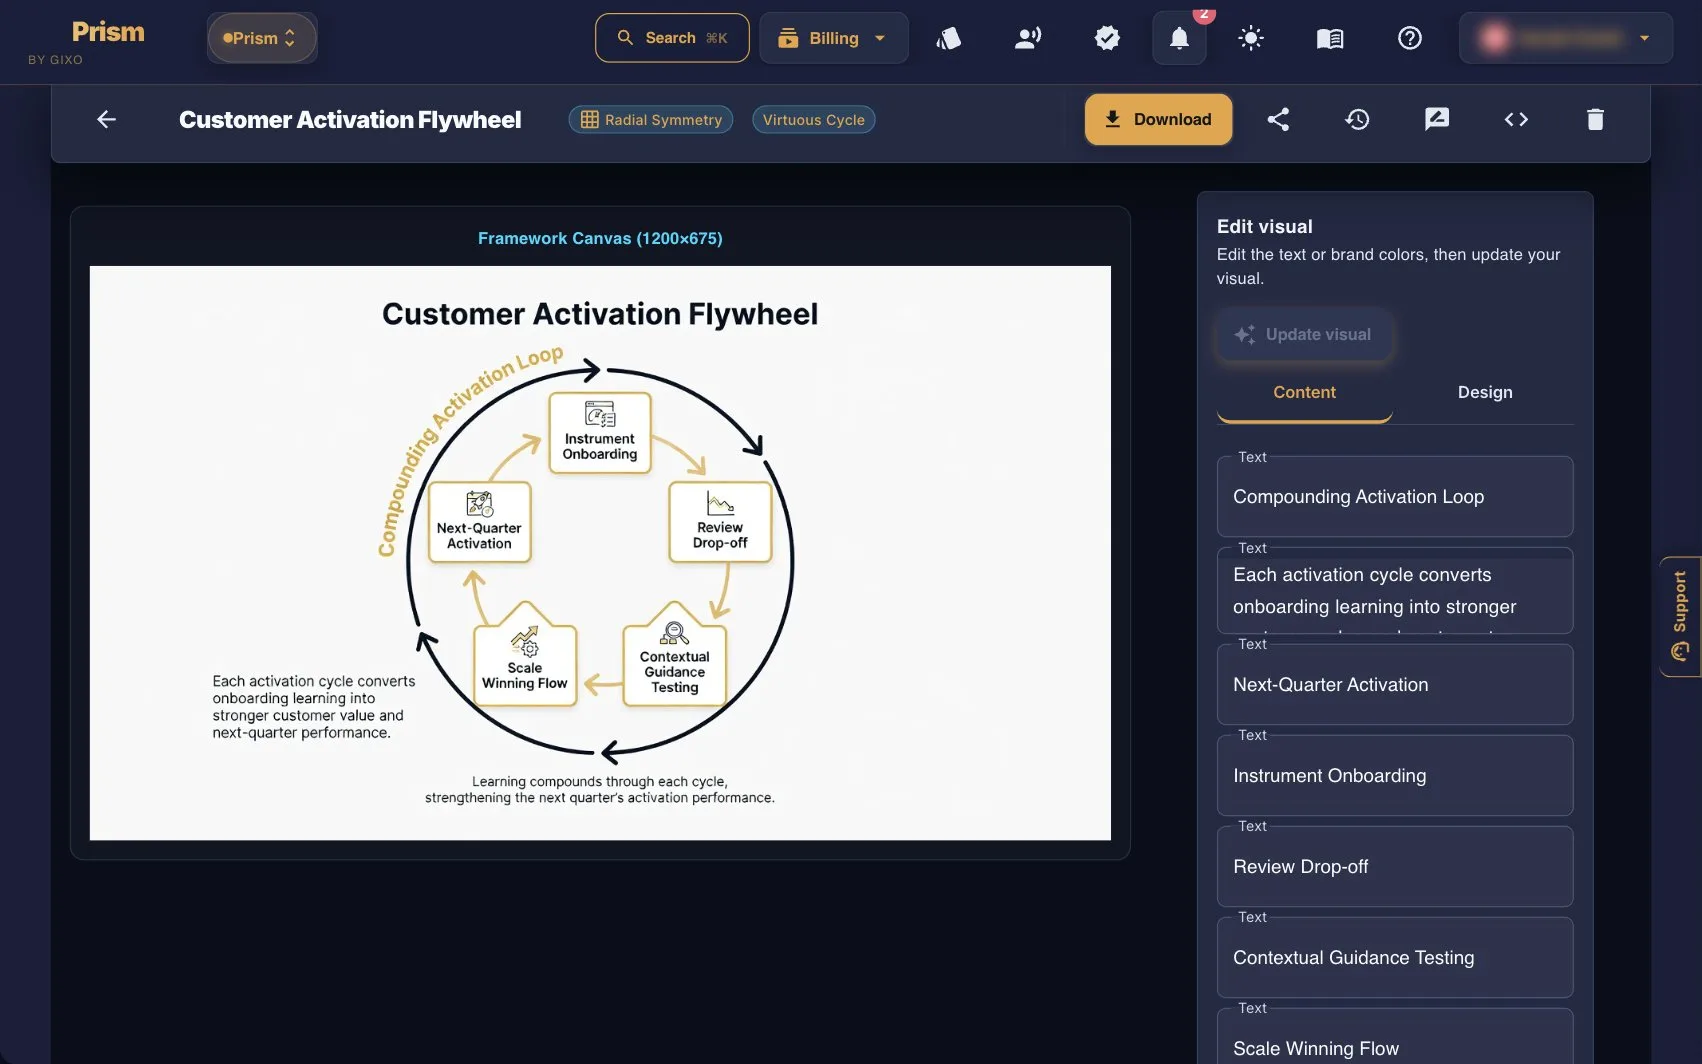
Current Prism framework canvas for a Customer Activation Flywheel with editable cycle labels
Framework canvas in the same workspace: edit the text, keep the geometry, download when the labels are right.
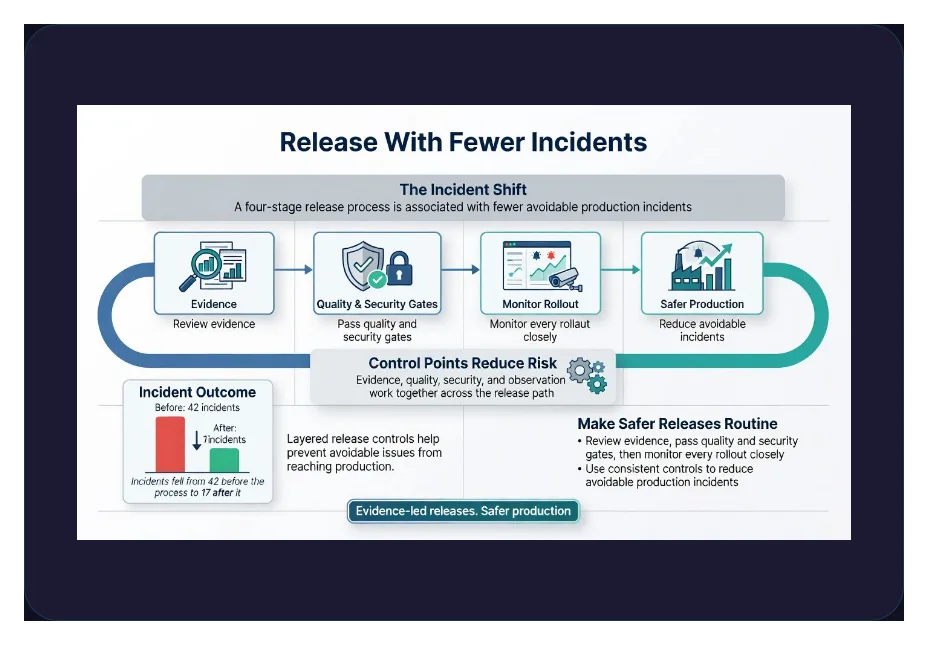
Downloaded Prism PNG: Release With Fewer Incidents infographic with a 42-to-17 incident chart
A PNG Prism actually writes: exact labels, the 42-to-17 incident figures, and no editor chrome.
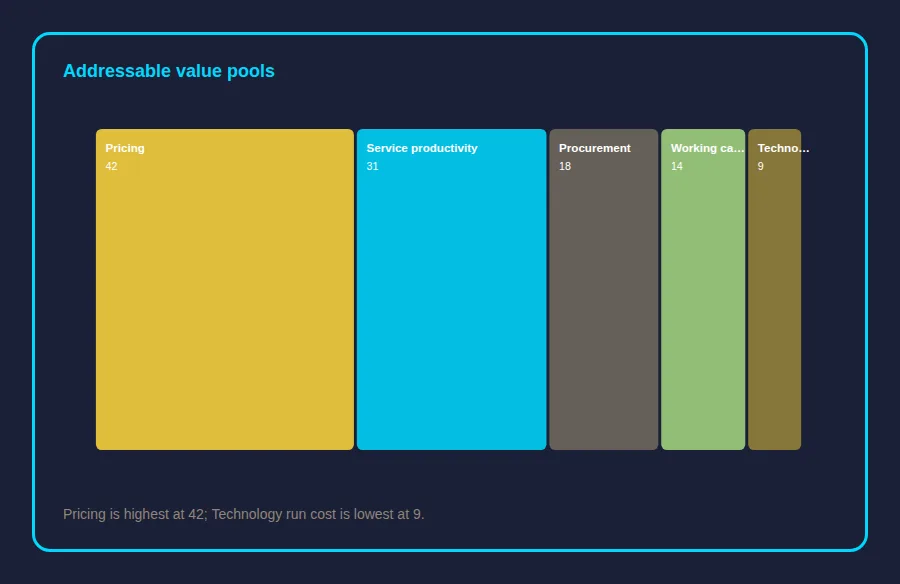
Downloaded Prism PNG: Addressable value pools chart with labeled segments
The chart PNG from the same workspace: labeled pools, not a screenshot of the editor.
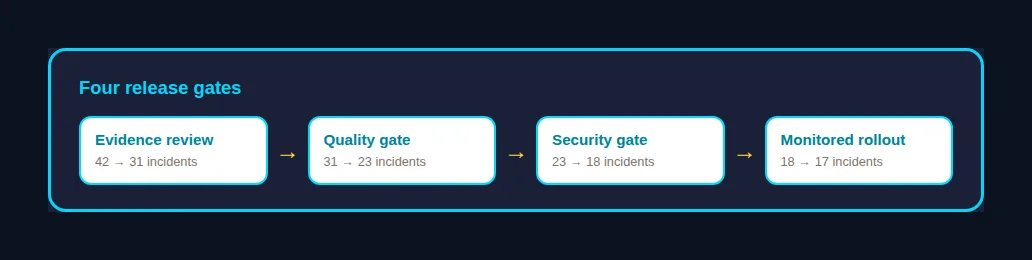
Downloaded Prism PNG: four release gates on one canvas
A process PNG Prism writes: four release gates, exact labels, ready to drop into a deck or brief.
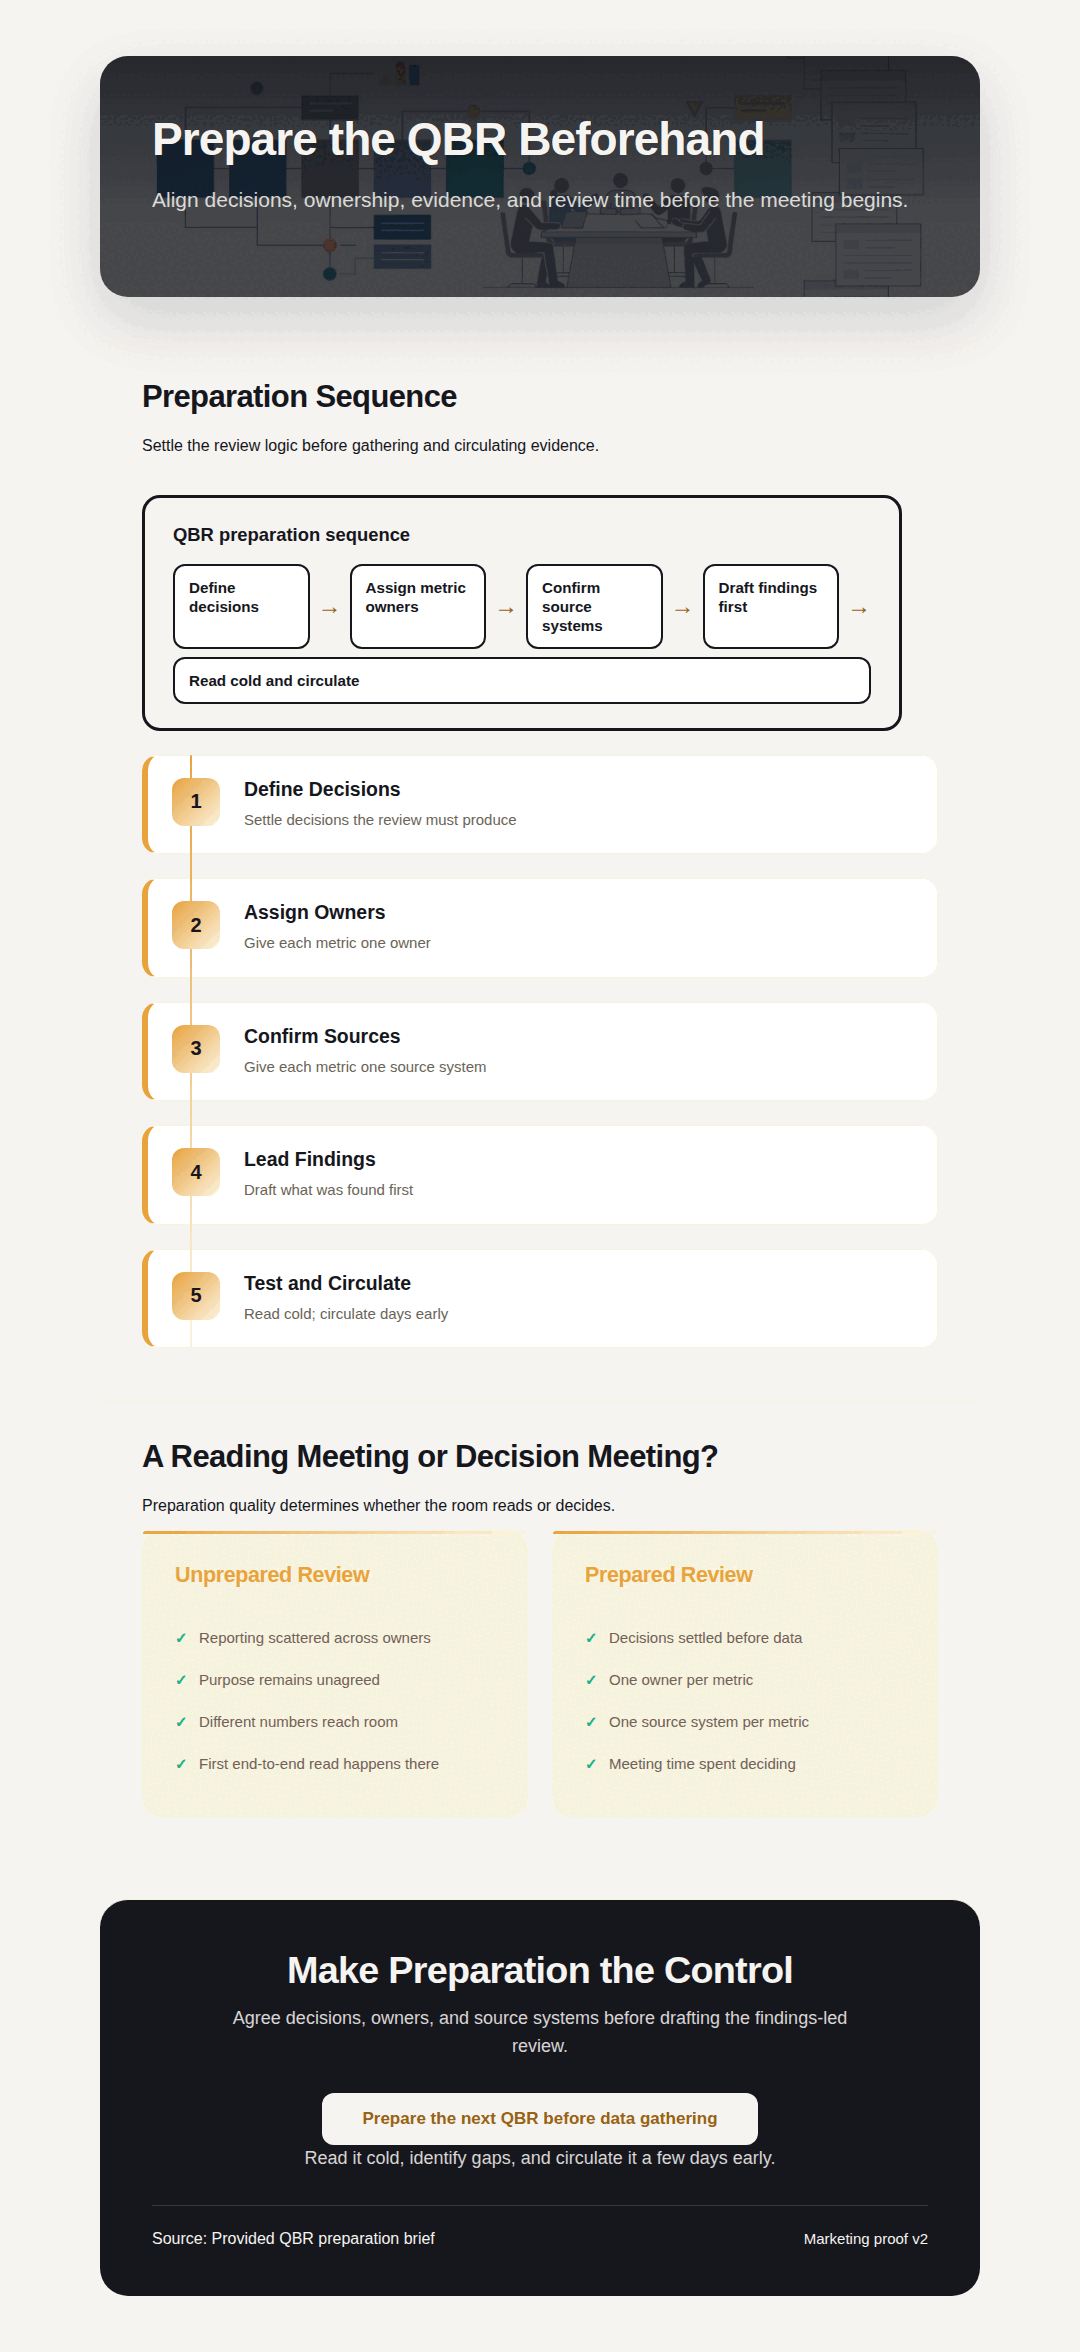
A Gixo Prism infographic: a hero band, five numbered steps, a four-figure stats grid and a closing action, stacked as one vertical page
Infographics

Turn an article, a report, or a few facts into a clean, on-brand infographic — every label exact, at any dimension.

Open Infographics
A Gixo Prism visual pack: nine coordinated landscape images sharing one palette and treatment
Visual Packs

A coordinated set of on-brand images for a launch or campaign — your brand text laid down exactly on every one.

Open Visual Packs
Visual makers

4 deterministic maker families covering 16 chart types, 11 diagram shapes, 2 flowchart modes, and 4 card types. Bring your own data and render it exactly in your Gixo account. No AI involved.

For consultants
Arc proposal → Prism proof visual → Lumen deck

Use Prism for the exact layer in a consulting workflow: BCG-style matrices, KPI trends, client intake flows, ROI stat cards, and risk callouts that move cleanly into proposals and decks.

Why Prism

Structured labels stay structured

In Prism's deterministic chart, diagram, flowchart, and card makers, supplied labels are rendered as data rather than generated as image text.

Exactness where the renderer supports it

4 deterministic maker families covering 16 chart types, 11 diagram shapes, 2 flowchart modes, and 4 card types. AI infographics and visual packs are generative and still require review of text, values, and visual details.

Theme controls for structured output

4 theme presets plus Brand Kit styling. Theme behavior and editability vary by visual type, so inspect the selected output before handoff.

Multiple formats and dimensions

One source becomes 13 structured infographic modules, a slide chart, a social pack, or an inline diagram - export via HTML, SVG, PNG, PDF, and PPTX.

Prism also lives inside your writing: generate a diagram, chart, or card from the content editor and it drops straight into your article, deck, or brief — on the same engine, with the same exact text.