
Miro Alternative
Miro is a collaborative whiteboard — great for live workshops, brainstorms, and retros with a team. Gixo Prism isn't a whiteboard at all: it's a focused generator for the one exact, brand-consistent diagram or chart you need afterward, once the thinking is done and something has to be finished and correct.
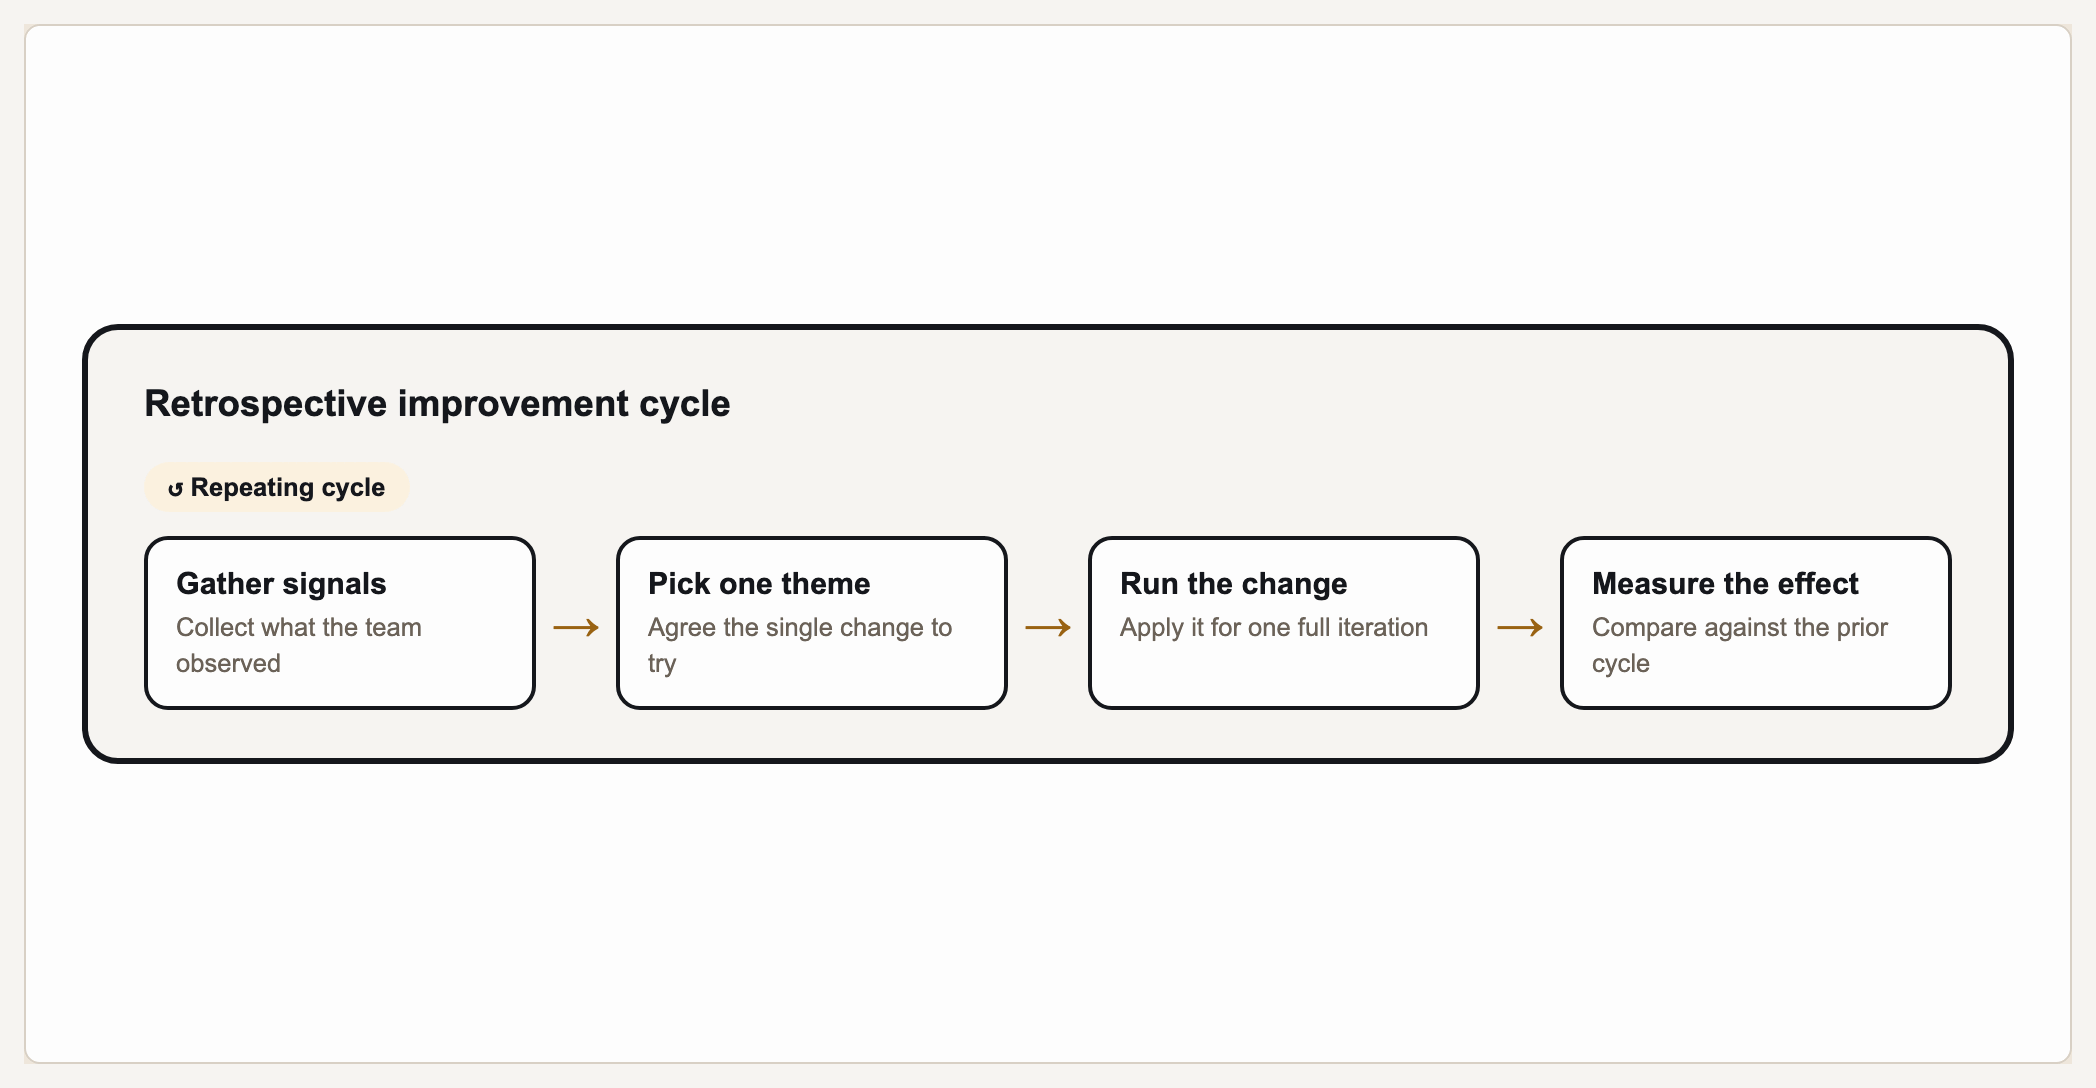
The visual stays useful after it leaves Prism.
Prism is designed for work that gets reviewed, edited, exported, and reused—not just admired in a feed.
Gixo Prism is not a Miro alternative in the collaborative-whiteboard sense — Miro wins that job decisively, with a live multiplayer canvas and 130+ integrations. Prism is a different, narrower tool: a deterministic generator for one finished chart, diagram, flowchart, or card at a time, rendered exactly from your data with no AI image model in the loop. It's the right fit specifically for the moment after the Miro board, when you need a single clean, brand-consistent visual to drop into a document, deck, or report.
When does Gixo Prism's diagram creator fit better than Miro?
Miro is where a team thinks together. Prism is where one visual gets finished — after the workshop, not instead of it.
Paste a CSV or your numbers and get a clean chart in any of 22 types, from bar, line and pie to waterfall, Gantt and heatmap. Rendered to SVG, so the values are always correct.
Describe a structure or paste steps and pick the shape: process, cycle, pyramid, funnel, tree, pillars, matrix, Venn, concentric, stack, or graph.
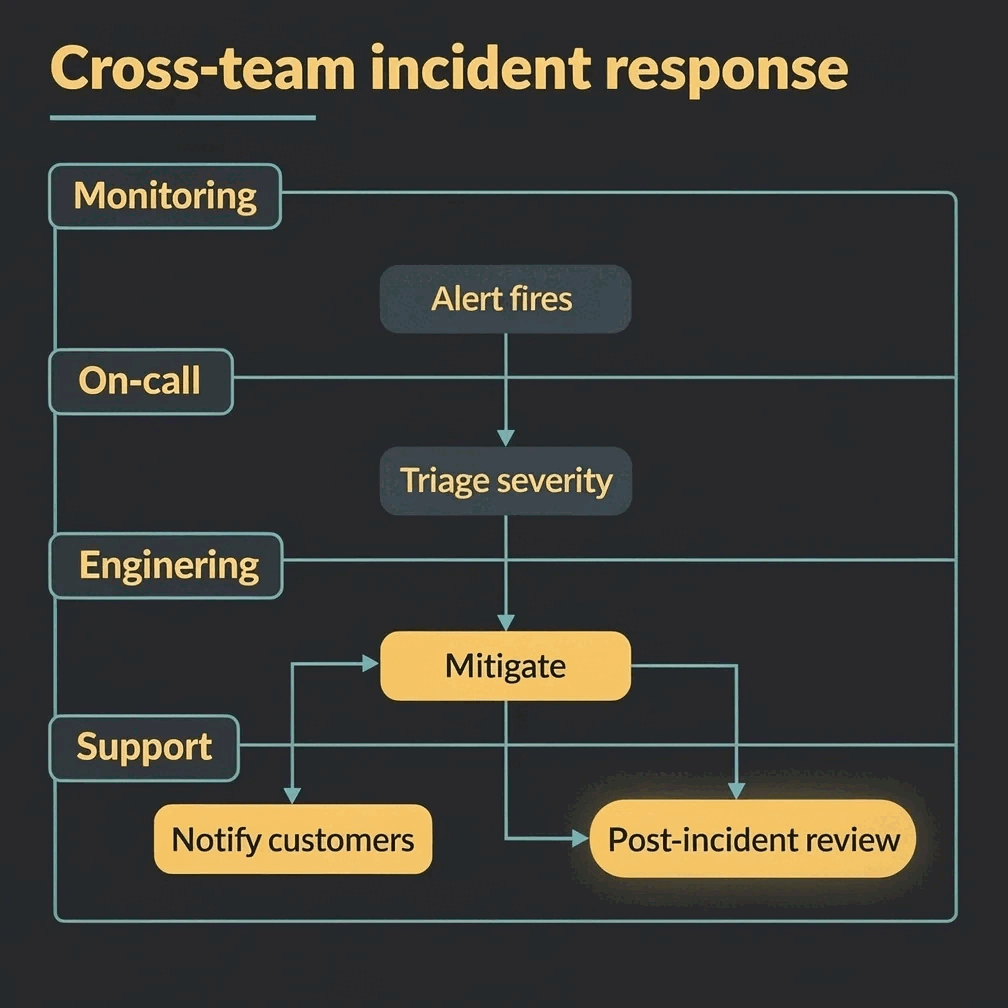
Map a decision flow or a cross-team swimlane and Prism lays it out cleanly, with exact labels and consistent spacing — a finished diagram, not a whiteboard snapshot.
Turn a single stat, quote, callout, definition, or comparison into a sharp, on-brand card you can drop into a deck, doc, or post.
The makers use no AI image model, so the same input always produces the same exact output — no garbled labels and no invented figures, and nothing left half-arranged on a canvas.
Prism applies your brand palette across every chart and diagram automatically, so a whole batch of visuals stays consistent instead of restyled by hand.
Change the data, labels, and layout and the makers re-render exactly. Export maker visuals as clean, self-contained HTML/SVG.
When you want a narrative piece from a topic or draft, Prism shapes it into a structured, content-backed infographic you can edit and export as PNG or HTML.
Need images to promote the work? A Campaign kit cuts one AI picture to every channel you pick — one design across the set, with captions and alt text to review.
How do you turn a Miro session into a finished visual with Gixo Prism?
Do the thinking wherever it happens — the finished, on-brand version takes minutes here.
Once the workshop or retro settles on a structure or a set of numbers, paste that CSV or describe the process here.
Choose a chart, one of the 14 diagram geometries, a decision-flow or swimlane flowchart, or a stat card.
Adjust the data, labels, and layout. Prism renders every value it uses exactly, rejects a draft carrying a figure absent from your source, and applies your brand palette across the set.
Take a maker visual as clean HTML/SVG into your deck, doc, or page. AI infographics also export as PNG.
Gixo Prism vs Miro: which one should you use?
Honestly, these aren't competing for the same job. Here's the real split.
- Miro wins on collaboration, decisively. Its real-time multiplayer canvas, sticky notes, templates, and 130+ integrations make it the right home for live workshops, brainstorms, retros, and roadmapping with a team. Prism has no equivalent and isn't trying to be one.
- Prism is not a whiteboard — it's a generator. There's no freeform canvas and no multiplayer session. You bring data or a structure, pick a maker, and get one finished, exact visual: a chart from a CSV, a diagram from 14 geometries, a flowchart, or a card.
- Exactness and brand consistency are where Prism helps. Its makers are deterministic — no AI image model in the loop — so a CSV becomes a correct chart and a process becomes a precise diagram, and your brand palette is applied automatically across the batch instead of restyled by hand on a board.
- Export is practical, with honest limits. Prism's makers export HTML, SVG, PNG, PDF, and PPTX. In the PPTX, bar, horizontal bar, stacked bar, line, area, pie, donut, scatter, radar, and bar-and-line combo charts arrive as native PowerPoint charts with their numbers in an embedded workbook that Edit Data opens; waterfall, funnel, Gantt, heatmap, treemap, symbol map, Marimekko, bubble, Sankey, bullet, slope, and dumbbell charts arrive as editable PowerPoint shapes and text, as does any chart PowerPoint cannot draw the way Prism does, such as a pie with a negative slice or an area chart with a missing value. Diagrams, flowcharts, and cards arrive as editable PowerPoint shapes and text, and a visual with a logo arrives as a full-slide image. The AI infographic exports PNG and HTML. Miro exports boards and frames in several formats, including for presentation use.
- Use both, for different moments. Run the workshop, brainstorm, or retro in Miro. When the session produces a structure or a set of numbers that needs to become one finished, on-brand diagram or chart for a document, deck, or report, build that piece in Prism.
Frequently Asked Questions
Explore the Prism visual toolkit
Updated