
AI Flowchart Generator and Flow Chart Maker
Turn text into a flowchart without drawing every box and connector. Gixo Prism's online flowchart maker lays out a decision flow or swimlane with exact labels, readable branches, and consistent spacing, so your workflow diagram stays reviewable instead of becoming a garbled AI image.
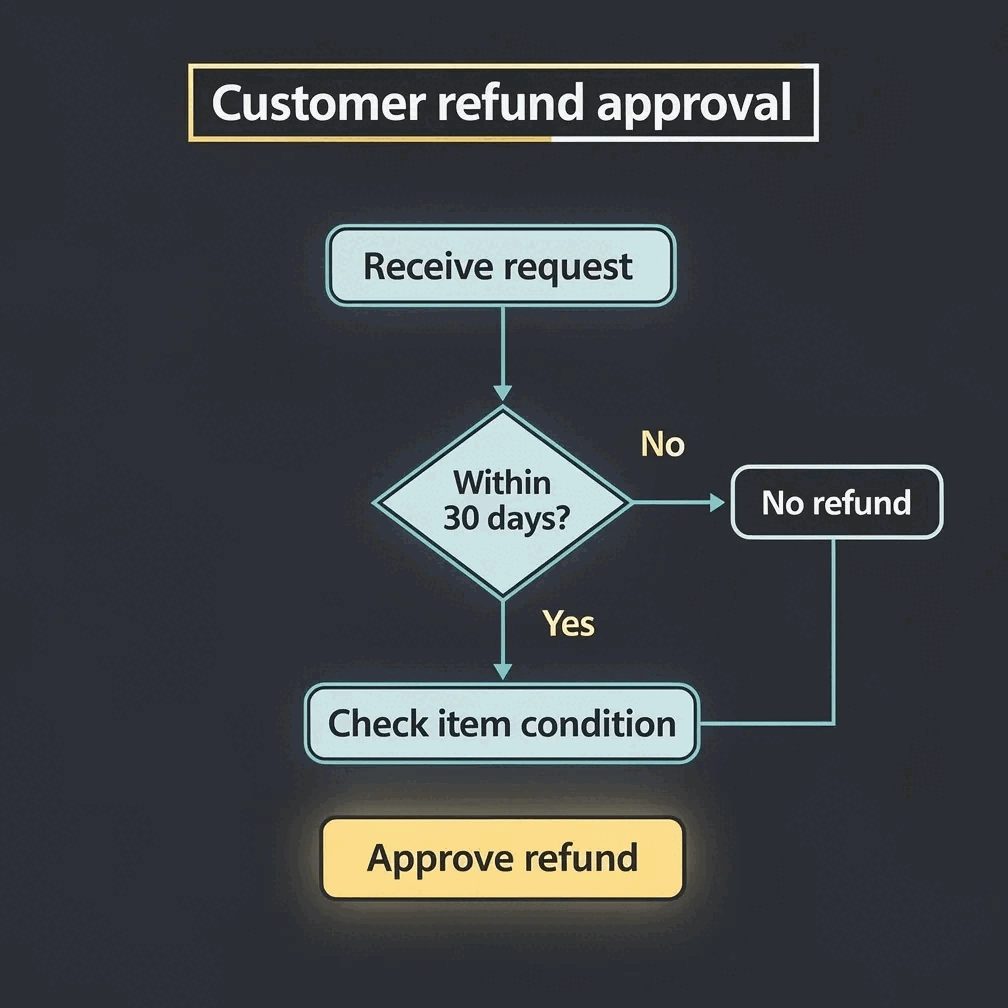
Gixo Prism is a flowchart generator from text: describe the steps, decisions, owners, and outcomes, then create an editable decision flow or swimlane in seconds. Because the maker lays out structured content deterministically instead of redrawing it as an image, every label and branch stays exact: the same input produces the same chart, on your brand palette, exportable as clean HTML/SVG.
What does the Prism AI flowchart generator do, at a glance?
The Prism AI flowchart generator at a glance — how it takes input, keeps your logic exact, and exports.
| Spec | Gixo Prism AI Flowchart Generator |
|---|---|
| Input | Plain-text description or pasted steps |
| Flowchart modes | 2 — decision flow, swimlane |
| Layout method | Deterministic (same input → same chart; no AI image redraw) |
| Label & logic fidelity | Exact — labels kept verbatim, no steps invented or dropped |
| Editing | Re-render on edit (change a step, rename a branch, reorder a lane) |
| Branding | Brand palette auto-applied to nodes, lanes, connectors |
| Export formats | Clean, self-contained HTML/SVG (maker visuals do not export PNG/PDF yet) |
| AI generation | None — the layout is deterministic |
| Account required | Yes — runs inside Gixo Prism |
| Free access | 14-day free trial, no credit card (no free plan) |
| Price after trial | From $10/month; Brand Kit on Business |
Capabilities current as of July 2026.
What is an AI flowchart generator that keeps the logic exact?
Prism's flowchart maker is deterministic — it lays out exactly the steps you describe, in one of two proven modes, with your brand palette applied.
Map a yes/no decision path — questions, branches, and outcomes. Prism arranges the nodes and connectors so the logic reads top to bottom without crossing lines.
Show who does what across roles or teams. Each lane keeps its own steps, so a hand-off process stays clear about ownership at every stage.
Paste your steps or describe the flow. Prism turns the words into a structured chart, keeping every label exactly as you wrote it.
Because the maker is deterministic, the same input always produces the same chart — no redrawn, garbled text and no steps invented or dropped.
Change a step, rename a branch, or reorder a lane and the chart re-renders exactly. Export it as clean, self-contained HTML/SVG.
Prism applies your brand palette to nodes, lanes, and connectors, so a flowchart matches the rest of your deck or doc without manual styling.
You bring the steps; Prism handles spacing, alignment, and arrow routing. No dragging boxes or nudging connectors by hand.
Pair a flowchart with data-exact charts, 11 diagram layouts, and stat cards — all in the same Prism workspace, all on the same brand.
Start a 14-day free trial with no credit card — there is no free plan, and everything is included during the trial.
How to make a flowchart from text
From a plain-text description to a finished, on-brand flowchart in four steps.
Type or paste your steps — the questions, the branches, and the outcomes — in plain language.
Choose a decision flow for branching logic, or a swimlane when you need to show who owns each step.
Adjust steps, labels, and lanes. Prism keeps the logic exact and applies your brand palette across the chart.
Export the flowchart as clean HTML/SVG and drop it into your deck, doc, or page.
Sample prompt: "Refund approval flow: customer requests a refund → is it within 30 days? If yes, approve and issue refund. If no, escalate to a manager for review → manager approves or denies."
Pick decision flow and Prism lays this out with exact Yes/No branches — every label kept verbatim, no steps invented or dropped. Change a step and the chart re-renders exactly.
How to create a flowchart people can verify
A useful chart is a controlled model of a process, not a decorative set of shapes. Do the process thinking before asking any text-to-flowchart AI or workflow diagram creator to arrange it.
1. Define the decision the chart must support
Write down the audience, scope, and intended decision. A support lead may need the escalation path; an auditor may need every approval and exception; a new employee may need only the normal route. The same real-world process can therefore produce several valid flowcharts at different levels of detail.
2. Gather process evidence before drawing
Use the material that actually governs the work: operating procedures, policy documents, tickets, forms, system events, and interviews with the people doing the job. Separate observed practice from the official process and resolve disagreements explicitly. A flow chart creator can organize what you provide, but it cannot verify an undocumented assumption.
3. Convert the evidence into structured statements
List each action as a verb and object, each decision as a specific question, each branch as a condition, and each ending as an outcome. Add the owner when a handoff matters. “Review the request” is vague; “Finance verifies that the amount is within the approved budget” gives an online flowchart maker enough information to show ownership and the rule being tested.
4. Generate the first draft, then review the model
Create the chart only after the source statements are stable. First review the sequence and branch logic; then check owners, labels, and layout. This order matters. Polishing a diagram before checking the process can make an incorrect model look authoritative.
5. Test the happy path and the failure paths
Walk one normal case and several exceptions from start to finish. Check what happens when data is missing, an approval is rejected, a system times out, or a task needs to be retried. Every decision must have an outgoing route and every route must reach a clear end state or an intentional loop.
Decision flowchart, workflow diagram, or process flow diagram?
Choose the diagram type from the question you need to answer. Similar-looking charts model different things, and one tool does not have to support every notation.
| Diagram type | Best question to answer | Typical content | Prism fit |
|---|---|---|---|
| Decision flowchart | What happens when a condition is true or false? | Questions, labeled branches, approvals, rejections, outcomes | Native decision-flow mode |
| Swimlane workflow diagram | Who owns each step and where do handoffs occur? | Roles or teams, actions, cross-lane handoffs, end states | Native swimlane mode |
| Process flow diagram | What is the end-to-end operating sequence? | Stages, tasks, decisions, inputs, exceptions | Use decision flow or swimlane when the process fits those structures |
| Data flow diagram | Where does information move, persist, or change? | External entities, processes, data stores, data flows | Use a dedicated data flow diagram maker; Prism does not provide DFD notation |
| Freeform system or UML diagram | How are technical components or software interactions related? | Components, classes, services, sequences, deployment boundaries | Use a dedicated UML or system-diagram tool |
This distinction also helps when comparing process mapping tools. A freeform canvas is useful when you need arbitrary symbols or technical notation. An automated workflow diagram creator is more efficient when the source can be expressed as ordered steps, decisions, and owners. Prism deliberately serves the second job with two focused modes rather than pretending to be a full data flow diagram maker or UML suite.
Making a flowchart online: an online flowchart maker with no install
Prism is a flow chart builder that runs in the browser, so creating a flowchart online needs no desktop install and no drawing skill. People arrive at this looking for a flowchart maker online, a free online flowchart maker, or simply somewhere to draw a diagram — the job is the same one.
A traditional flowchart designer asks you to place every box and connector by hand. Here you write the steps and the decisions in plain language, and the layout is derived from that structure — so a flow chart online stops being a drawing exercise and becomes a writing one.
Because the diagram is generated from the steps you wrote, reviewing it means reading the logic back. Branches that go nowhere and decisions with only one exit are visible in the structure rather than hidden in the artwork.
The result exports as SVG and drops into a Lumen slide, so a flow diagram online does not have to be re-drawn to be presented. Flowchart, process flow and workflow all come out of the same builder — only the vocabulary differs.
What is a flowchart? Flowchart symbols and writing rules
Consistent visual grammar makes a chart faster to scan. The label inside each shape should tell the reader exactly what occurs there.
| Element | Use it for | Write the label like this |
|---|---|---|
| Start or end | A clear process boundary | “Request received” or “Refund issued” |
| Process step | An action or transformation | Verb + object: “Validate account status” |
| Decision | A rule with distinct outcomes | A question: “Is the request within 30 days?” |
| Connector | Direction between steps | Label conditional routes “Yes,” “No,” “Approved,” or “Rejected” |
| Swimlane | Responsibility for a group of steps | Name the role or system, not an individual person |
Keep decisions atomic. “Is the request complete and approved?” hides two tests and makes a “No” branch ambiguous. Split it into “Is the request complete?” followed by “Is the request approved?” Use the same term for the same actor or artifact throughout the chart, and avoid crossing connectors when a cleaner top-to-bottom order is possible.
Swimlanes show responsibility, not hierarchy. Create lanes only for actors who perform a step, approve a decision, or receive a handoff. Too many lanes turn a workflow diagram into an organizational chart and make the process harder to follow.
How to prompt an AI flowchart generator from text
A strong prompt specifies the diagram objective, scope, actors, decision rules, exceptions, and desired level of detail. Explicit source text produces a more useful first draft than a broad topic.
Use this prompt pattern: “Create a [decision flowchart or swimlane workflow] for [audience and process]. Start when [trigger]. Include [actors], [required steps], [decision rules], [failure or rejection paths], and [end states]. Keep labels concise and do not add steps that are not listed.”
Example: “Create a swimlane workflow for procurement approval. Use lanes for requester, manager, finance, and purchasing. Start when a request is submitted. Include budget validation, manager approval, a rejection route, finance review above $10,000, a return-for-information loop, purchase-order creation, and cancelled and completed end states.”
A generic AI diagram generator from text may interpret missing logic and create a plausible route. Prism's deterministic flowchart maker does not invent missing business rules. That makes omissions visible: if a rejection outcome or owner is absent from the text, add it explicitly and re-render.
Flowchart validation checklist
Review the process in layers so a clean layout never hides a logic error.
- Scope: the start trigger and final outcomes match the purpose of the chart.
- Sequence: every step is in the order work actually occurs, including loops and retries.
- Decisions: each question tests one rule and every branch has an unambiguous label.
- Ownership: each swimlane step belongs to the role or system responsible for it.
- Exceptions: rejection, missing-data, timeout, cancellation, and escalation paths end somewhere intentional.
- Evidence: important steps and thresholds can be traced to an agreed source.
- Readability: labels are concise, terminology is consistent, and connectors are easy to follow.
- Change control: the chart has an owner and can be revised when the real process changes.
The most common mistakes are starting with shapes before defining scope, using vague decision labels, omitting failure states, mixing process movement with data movement, and accepting a generated diagram as verified truth. A good AI flowchart maker accelerates modeling; it does not replace process review.
Why choose a deterministic AI flowchart generator over an image-based one?
Three ways teams make flowcharts today — and what each is actually good at.
- Image-only AI tools (ChatGPT, DALL·E, Midjourney) are great for illustration, but they draw a flowchart as pixels — so the boxes come out with garbled labels, missing arrows, and steps that don't match what you asked for. Not safe when the logic has to be right.
- Diagramming tools (Lucidchart, draw.io, Miro) give you a precise canvas, but you place every box, route every arrow, and align every lane yourself. Powerful and flexible — and entirely manual.
- Gixo Prism sits in between: you describe the flow in text and a deterministic maker lays out a decision flow or swimlane with exact labels, governed by your brand palette. The trade-off is two focused modes rather than a freeform canvas with every chart shape.
The honest picture: Prism supports two flowchart modes — decision flows and swimlanes. It does not try to be a freeform whiteboard, and it does not draw your chart as an AI image. That is the point. For visuals where the steps and labels must stay exact, deterministic layout beats a redrawn picture every time.
Frequently Asked Questions
Explore the Prism visual toolkit
Updated