
Generated as a picture
Text and values may be approximated as pixels, making the result hard to review or reuse.
Prism creates exact charts, diagrams, flowcharts, cards, infographics, and coordinated visual packs. Your labels remain readable, your numbers remain intact, and your brand stays consistent from one asset to the next.
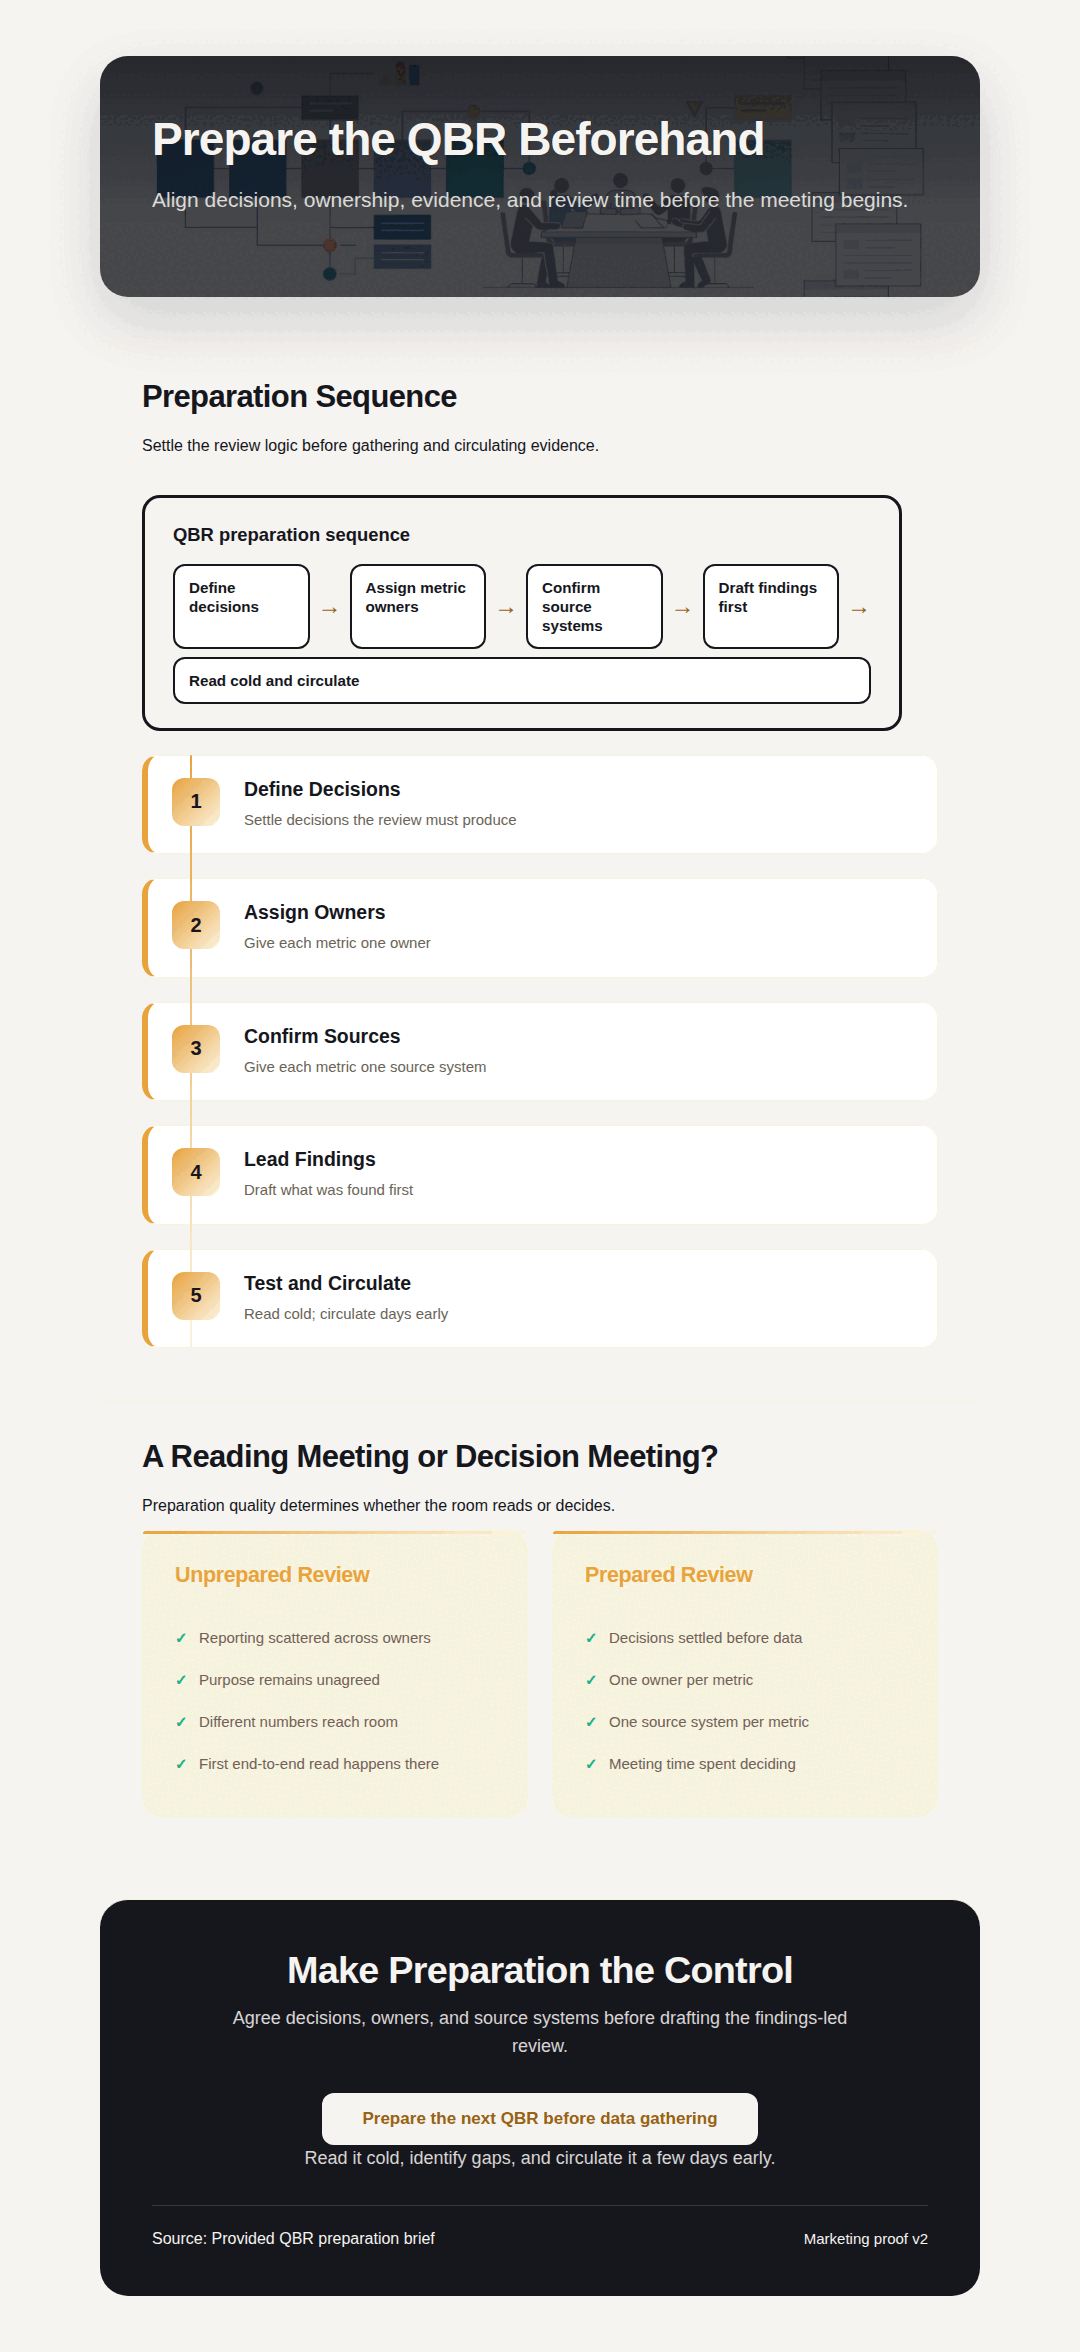
Explore the visual makers, chart types, infographic modules, and presets available in Prism.
General image models are good at atmosphere. Prism is built for information: the names, numbers, sequence, hierarchy, and source context that must survive review.
Text and values may be approximated as pixels, making the result hard to review or reuse.
Prism lays out the information you provide, so labels stay legible and values stay faithful to the source.
Bring your own data or text. Prism renders it directly—no image model rewriting the information. Export maker visuals as HTML, SVG, PNG, PDF, and PPTX. A PPTX export is editable PowerPoint shapes and text: a chart arrives as shapes, not as a PowerPoint chart with editable data, and a visual with a logo arrives as a full-slide image.
Turn CSV-style data into bar, line, area, pie, donut, or scatter visuals with exact labels and values.
Open chart makerMap stages, systems, comparisons, and frameworks into a readable visual hierarchy.
Open diagram makerShow sequence, logic, approvals, and ownership with structured paths and decision points.
Open flowchart makerCreate stat, quote, callout, definition, and comparison cards that keep every word clear and reusable.
Open card makerPrism analyzes the source, recommends a suitable layout, and organizes the material into 13 structured infographic modules. You choose the structure and theme before generation.
Paste text, use a draft, or start from structured data.
Compare layouts such as processes, timelines, grids, stats, and comparisons.
Select a preset or carry your Brand Kit into the design.
Take the result into content, reports, proposals, and decks.

Prism changes the hierarchy and layout to fit the material—from destination guides to operational proof and historical timelines.
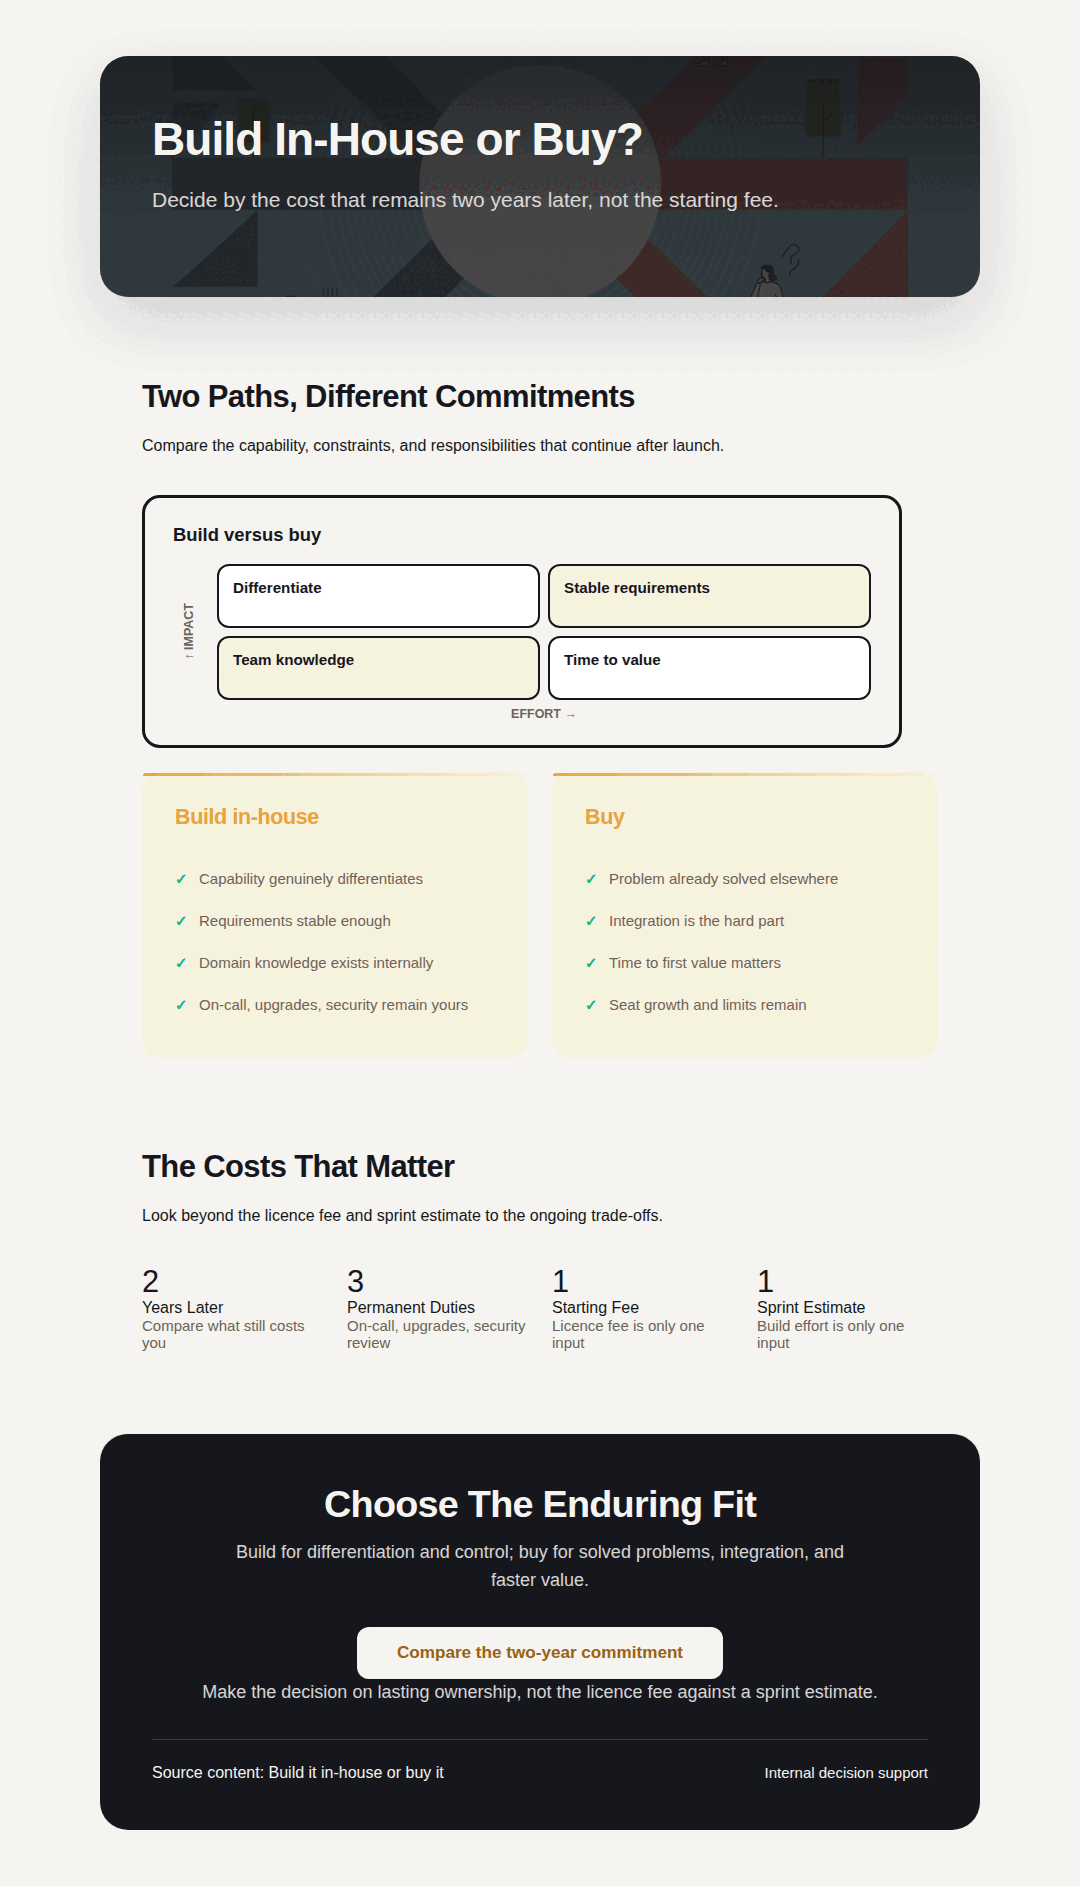
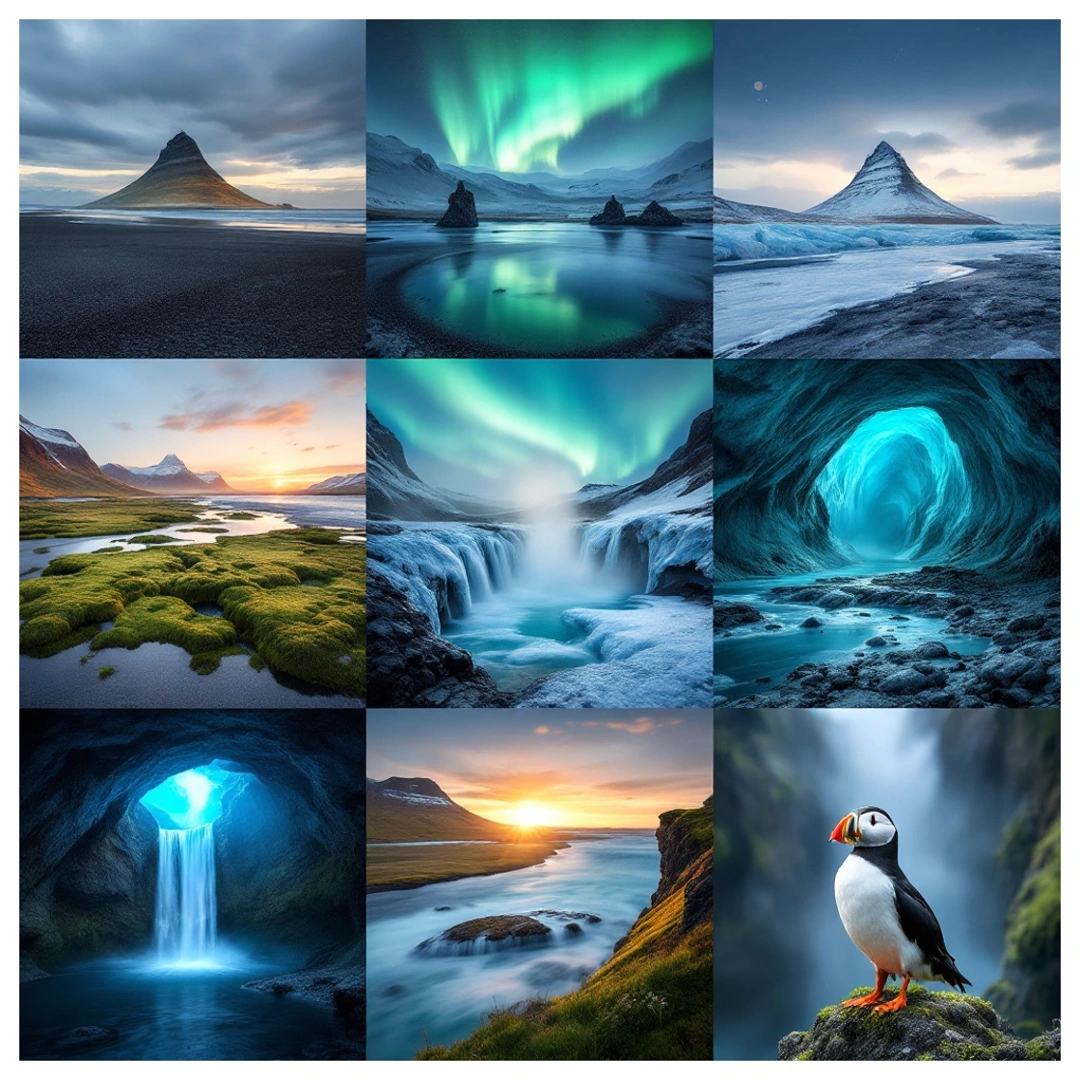
Generate related assets for social, web, launches, and distribution. Keep the art direction, palette, and message connected while adapting the dimensions for each channel.
Set the directionDescribe the campaign and select the formats you need.
Keep the set coherentCarry the same visual language across a coordinated batch.
Refine without starting overAdjust overlays, crop, resize, and prepare each asset for delivery.


Move from source material to a clear visual without losing the context your clients, operators, or stakeholders need.
Turn findings into matrices, process flows, KPI stories, and proof visuals that travel cleanly into proposals and decks.
Prism for consultants 02Transform a source article or campaign idea into infographics and coordinated assets for distribution.
Visuals for marketers 03Keep source values, labels, and reporting context intact while making the result easier to discuss.
Visuals for data teamsLabels are laid out as text, instead of being painted into an image and guessed.
Use 4 theme presets plus Brand Kit styling to create repeatable visual treatment.
Makers export as HTML, SVG, PNG, PDF, and PPTX; infographics as PNG and HTML; and Visual Packs as PNG, JPG, and WebP.
Bring exact visuals into the articles, briefs, proposals, and decks where the work continues.
Infographics, charts, diagrams, flowcharts, cards, and visual packs - rendered for exact labels and reusable brand styling.
The deterministic makers render the labels, values, and structure you provide. Infographics use structured modules so the content remains organized and reviewable.
Yes. Choose from 4 presets or apply Brand Kit styling for repeatable colors, typography, and visual treatment.
Makers export as HTML, SVG, PNG, PDF, and PPTX, infographics as PNG and HTML, and Visual Packs as PNG, JPG, and WebP for use in content, reports, presentations, campaigns, and web pages.
Start with an exact maker or turn longer source material into a complete visual story.