
Prioritization Matrix Maker
List your initiatives, score each on impact and effort, and Gixo Prism plots them into the exact impact-effort 2x2 — quick wins, big bets, fill-ins, and time sinks — so it's obvious what to do first. Value vs. effort, reach vs. cost, or any priority pair you need for a roadmap, backlog, or triage call.
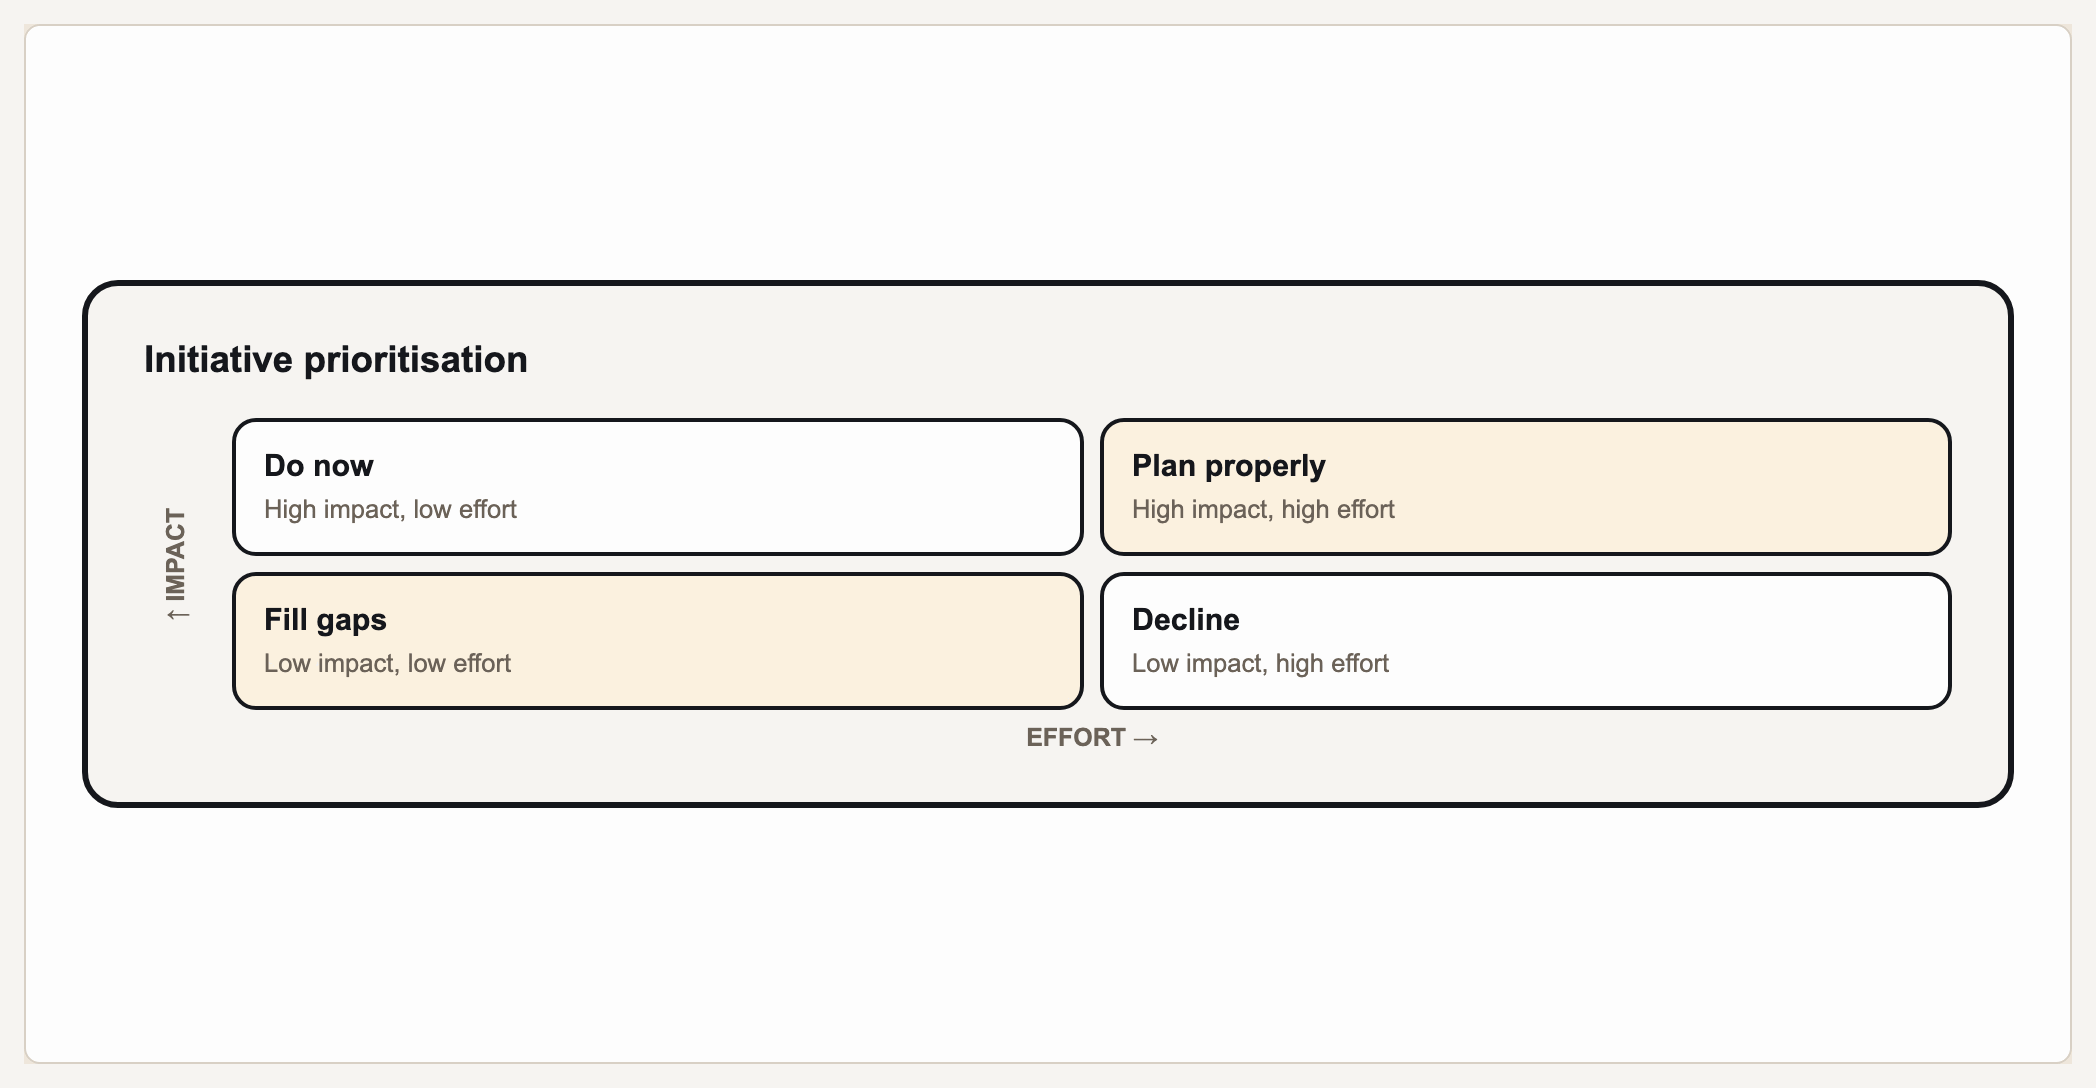
A prioritization matrix (also called a priority matrix, impact-effort matrix, or action priority matrix) plots each item across two axes — usually impact vs. effort — to sort your work into four quadrants: quick wins (high impact, low effort), big bets (high impact, high effort), fill-ins (low impact, low effort), and time sinks (low impact, high effort). Gixo Prism's diagram maker has a dedicated matrix geometry built for exactly this: you name your two axes and place your items into the four quadrants, and Prism lays out the grid deterministically, with no AI image model in the loop. The items you enter land in the exact quadrant you meant, every time.
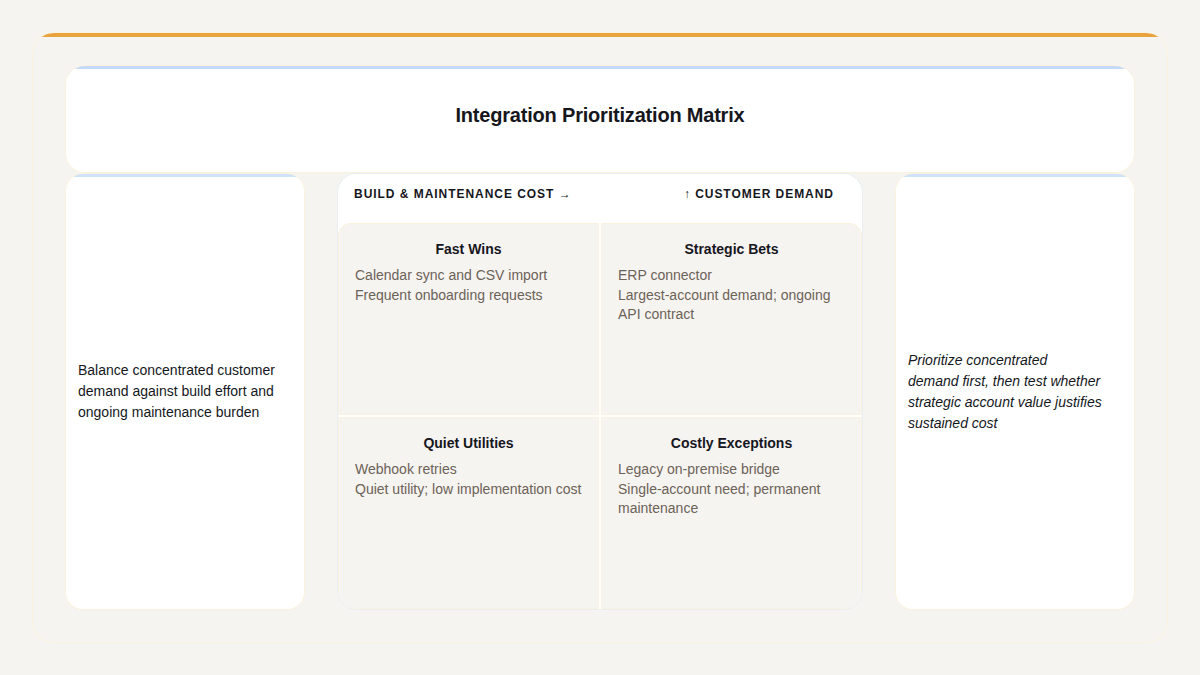
A real Gixo Prism prioritization matrix — every candidate placed against the two axes you name.
What makes a prioritization matrix maker actually usable?
The impact-effort 2x2 is a simple shape on paper — but every axis label and quadrant placement has to land exactly right, or the "do this first" argument it's making falls apart.
Use the classic impact vs. effort framing, or rename the axes — value vs. effort, reach vs. cost, urgency vs. importance. Prism's matrix geometry renders exactly the axis labels you type, not a generic template.
Place your items and the four quadrants read at a glance — quick wins to ship now, big bets to plan, fill-ins for spare capacity, and time sinks to drop. The layout does the sorting argument for you.
No AI image model draws this grid. Prism renders the matrix geometry deterministically, so every item lands in the exact quadrant you assigned it — no garbled labels, no drifted gridlines.
Apply your brand palette to the matrix and it stays consistent with every other chart and diagram you build in Prism — plus 4 theme presets (conservative, bold, brand-conservative, brand-bold) to start from.
Re-score an item, move it to a different quadrant, or adjust the theme, and the matrix re-renders exactly. Export as clean, self-contained HTML/SVG to drop into a roadmap deck, doc, or page.
When a plain 2x2 isn't enough, the same diagram maker covers process, cycle, pyramid, funnel, tree, pillars, Venn, concentric, stack, and graph geometries — all deterministic, all on-brand.
How do you make a prioritization matrix in Prism's diagram maker?
Four steps from a list of initiatives to an exact, on-brand impact-effort matrix.
Write down every initiative, feature, or task and rate each one on impact and effort — high or low is enough to place it.
Keep the classic impact vs. effort, or set your own pair — value vs. effort, reach vs. cost, urgency vs. importance.
Choose quick win, big bet, fill-in, or time sink for each item after reviewing its impact and effort. Supply those quadrant assignments in the maker; Prism draws your chosen grid and labels.
Pick a theme preset or your Brand Kit, then export the matrix as clean HTML/SVG for your roadmap deck, doc, or page.
Frequently Asked Questions
Explore the Prism visual toolkit
Updated