
Gixo Prism · Visual guide
Types of Diagrams
A diagram expresses a relationship rather than a quantity, and there are only about six relationships worth diagramming: sequence, hierarchy, cycle, comparison, composition and flow with decisions. Choosing a diagram type means naming which of those you have. Most unreadable diagrams are the result of forcing one relationship into a shape built for another.
Last reviewed: August 2026
A current Prism output
This is a current deterministic Prism render, generated from structured nodes and labels rather than an image mockup.
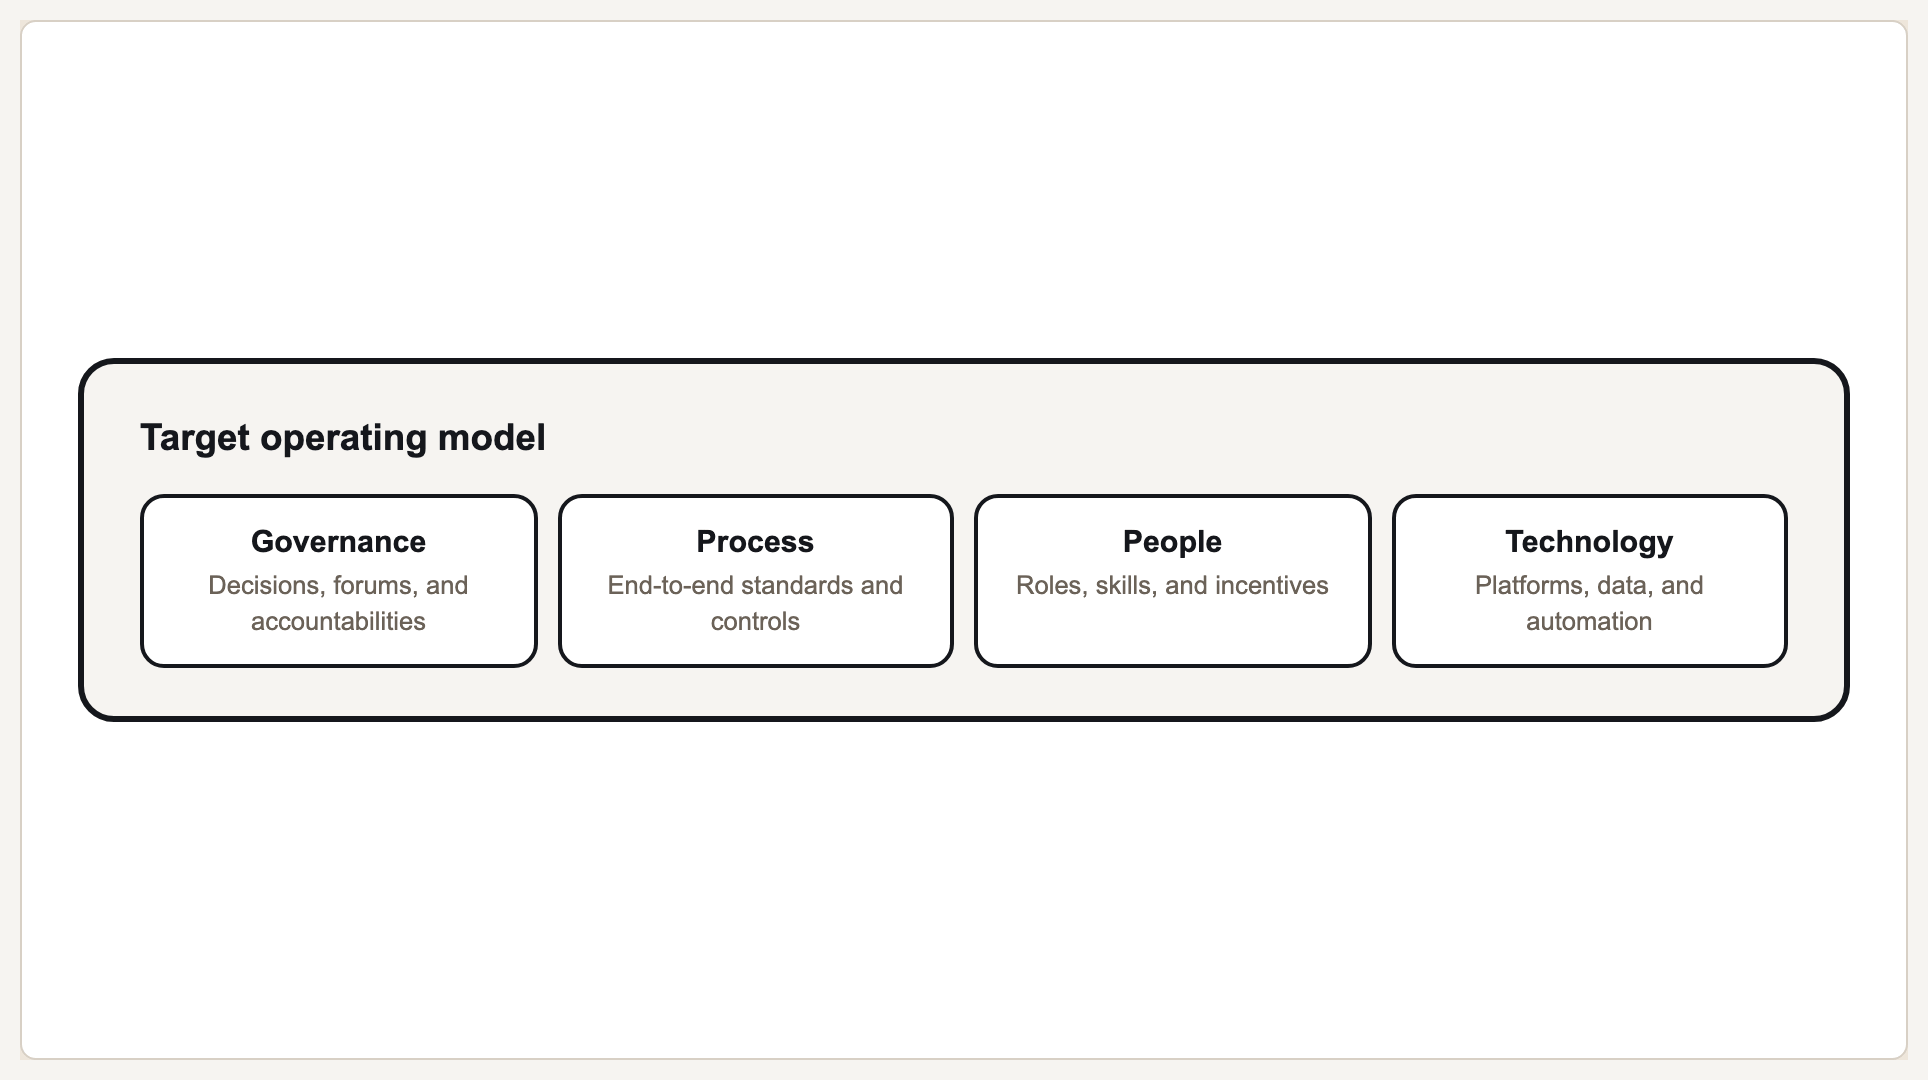
Diagrams express relationships, not numbers
The distinction between a chart and a diagram is what is being encoded. A chart encodes quantity; a diagram encodes relationship. If your content has no numbers but does have an order, a containment, or a dependency, you want a diagram, and the type follows directly from which of those it is.
The most common failure is the box-and-arrow sprawl: a diagram with no consistent meaning for its arrows, where some mean 'leads to', some mean 'contains' and some mean 'is related to'. If the arrows carry more than one meaning, the reader has to decode each one individually and the diagram has stopped saving them anything.
The second most common failure is a cycle drawn for something that is not cyclical. A cycle implies the last step feeds the first. If it does not, the shape is making a claim your content does not support, and a process or roadmap is the honest choice.
Diagram types and the relationship each expresses
| Diagram | Expresses | Use when |
|---|---|---|
| Process | Ordered sequence with a start and end | Steps run once, in order |
| Cycle | Sequence that returns to its start | The output of the last step genuinely feeds the first |
| Tree / hierarchy | Parent and child containment | Structure, decomposition or org relationships |
| Org chart | Reporting relationships between people or units | The hierarchy is specifically organisational |
| Matrix / quadrant | Position on two dimensions | Comparing items on two independent axes |
| Venn | Overlap between sets | The intersection itself is the point |
| Pyramid | Layers where each rests on the one below | There is a genuine foundation-to-apex dependency |
| Funnel | Narrowing through ordered stages | Volume drops at each stage |
| Swimlane | Flow across owners or systems | Who does what matters as much as the order |
| Roadmap / timeline | What happens when | Time is the organising dimension |
| Concentric | Layers of scope around a core | Nesting, not sequence |
| Stack | Layers built on each other | Architecture or capability layers |
Picking a diagram in four questions
Is there an order?
If yes and it terminates, use a process. If yes and it returns to the start, use a cycle. If the order is calendar-driven, use a roadmap or timeline.
Is there containment?
Parent-child structure is a tree. If the containment is organisational, an org chart. If it is nesting scope, concentric rings.
Are you comparing on two dimensions?
That is a matrix or quadrant, and it needs both axes named and labelled at both ends or it becomes decoration.
Does ownership matter?
If the reader needs to know who does each step as well as the order, use a swimlane rather than a plain process.
What Gixo Prism does here
Prism's diagram maker renders 11 geometries deterministically: process, cycle, pyramid, funnel, tree, pillars, matrix, Venn, concentric, stack and graph. You supply the structure and it handles the layout and spacing, so the geometry stays consistent across a deck rather than being redrawn by hand each time.
Types of diagrams: FAQ
What is the difference between a chart and a diagram?
A chart encodes quantities so they can be compared. A diagram encodes relationships — order, containment, overlap, dependency — where there may be no numbers at all.
What are the most common diagram types?
Process, cycle, tree, matrix and venn cover the large majority of business diagrams. Prism renders 11 geometries in total.
When should I use a swimlane instead of a flowchart?
When ownership matters. A plain flowchart shows what happens next; a swimlane also shows who is responsible, which is what handoff problems are usually about.
Why do diagrams become unreadable?
Usually because the arrows carry more than one meaning, or a cycle has been drawn for something that does not cycle. Both force the reader to decode each element separately.
Build a diagram from your own structure
The free diagram maker takes your steps or hierarchy and renders the geometry. No account, nothing stored.