Client-ready frameworks, charts, and decision visuals
Build the proof layer between an Arc proposal and a Lumen deck: exact matrices, KPI charts,
decision flows, and ROI cards that keep the numbers and labels intact.
Prepare the chart, comparison or handoff your client needs
Inspect the prepared input, open it in the matching maker, then adapt and review the result. All sample figures and options below are fictional.
How do I turn sales CSV into an editable PowerPoint chart?
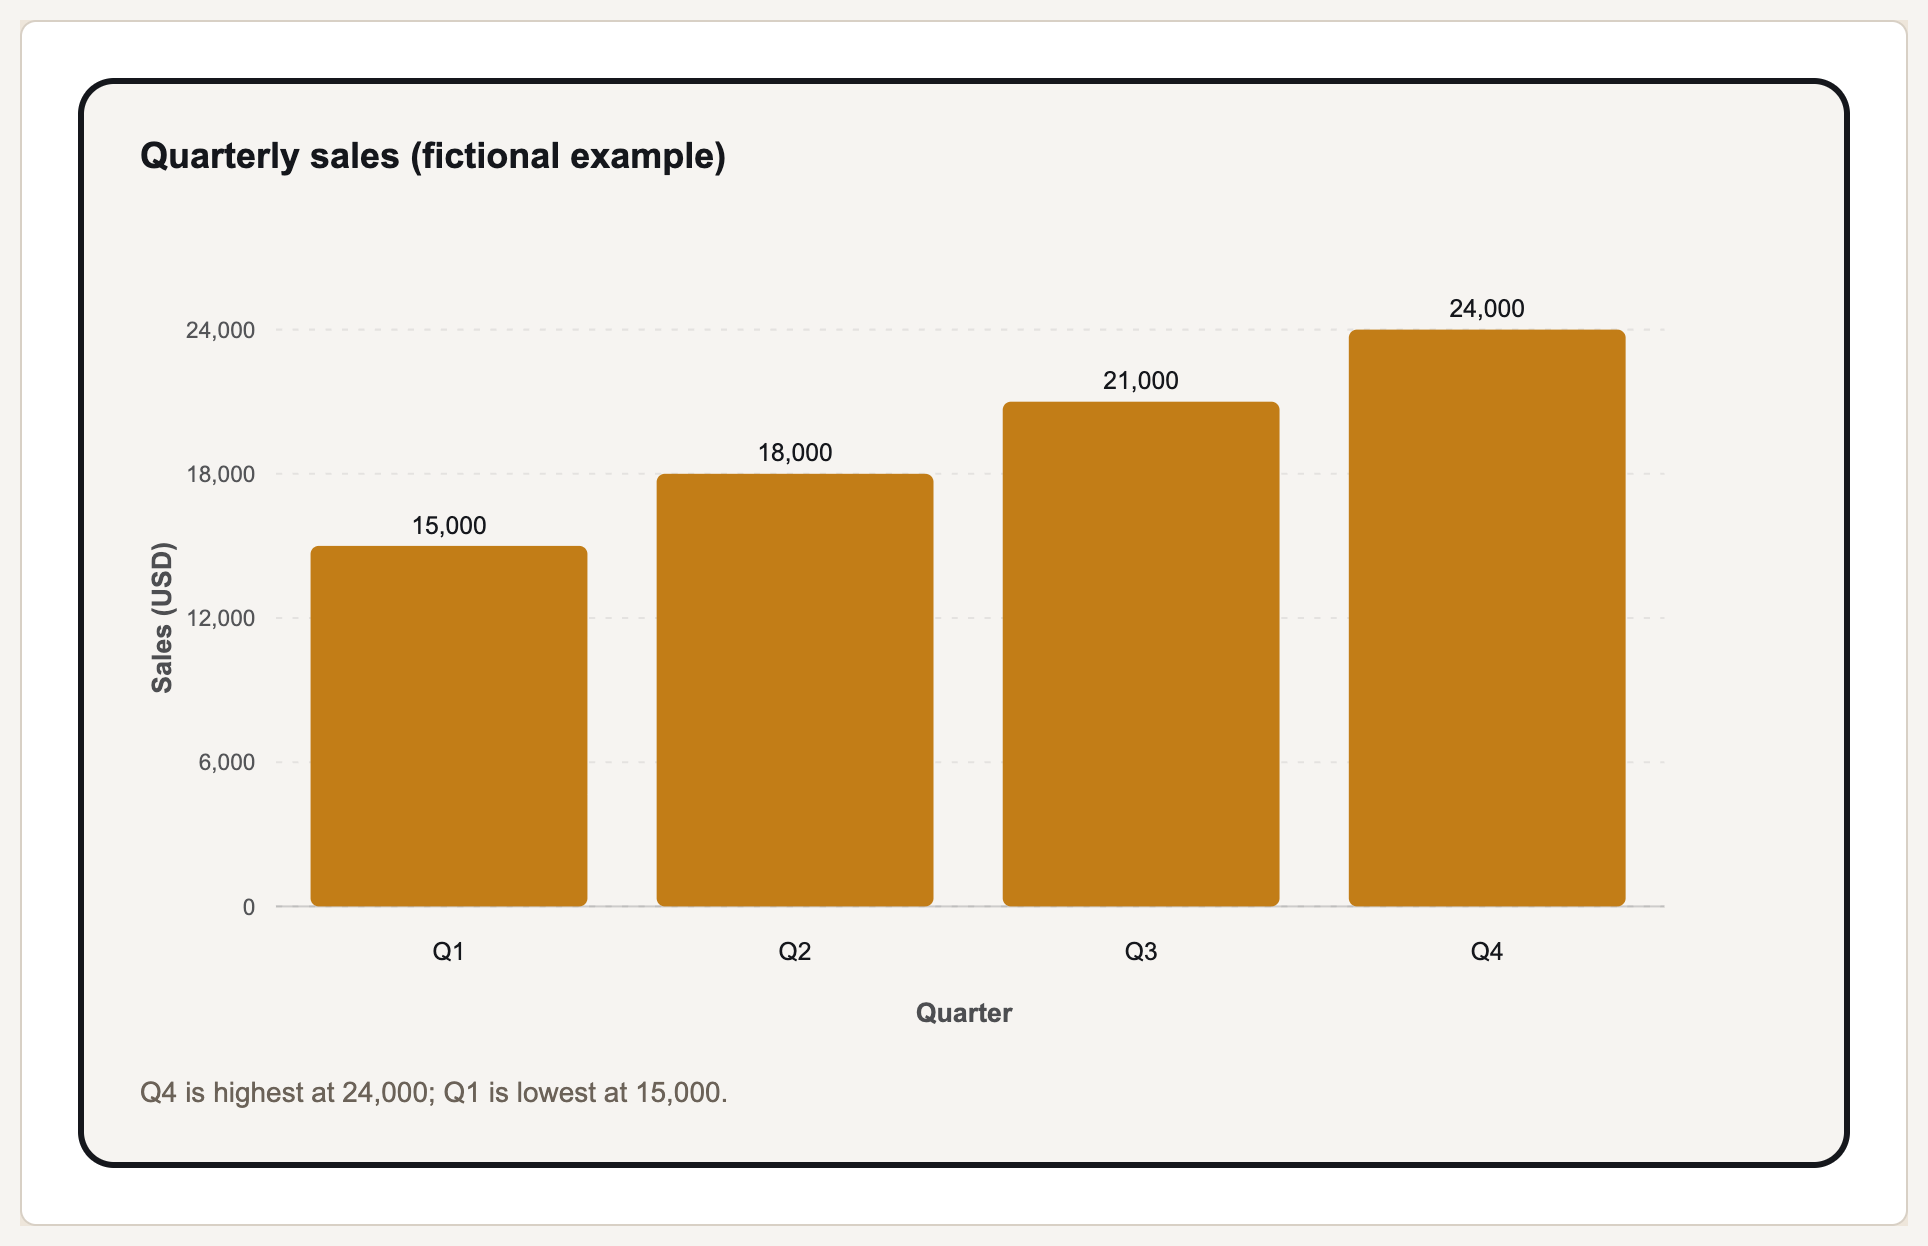
Load four quarters of fictional sales, check the USD unit, then make a bar chart. The PPTX export contains a native PowerPoint chart with an embedded workbook, so its values remain editable.
Review before sharing: Check the four quarter labels, all sales values and the USD axis before sharing. Replace the fictional numbers with your own measured sales.
The renderer preserves supplied values; it does not validate your sales records. Free HTML and SVG carry Gixo attribution. A Prism trial or plan adds clean PNG, PDF and PPTX exports.
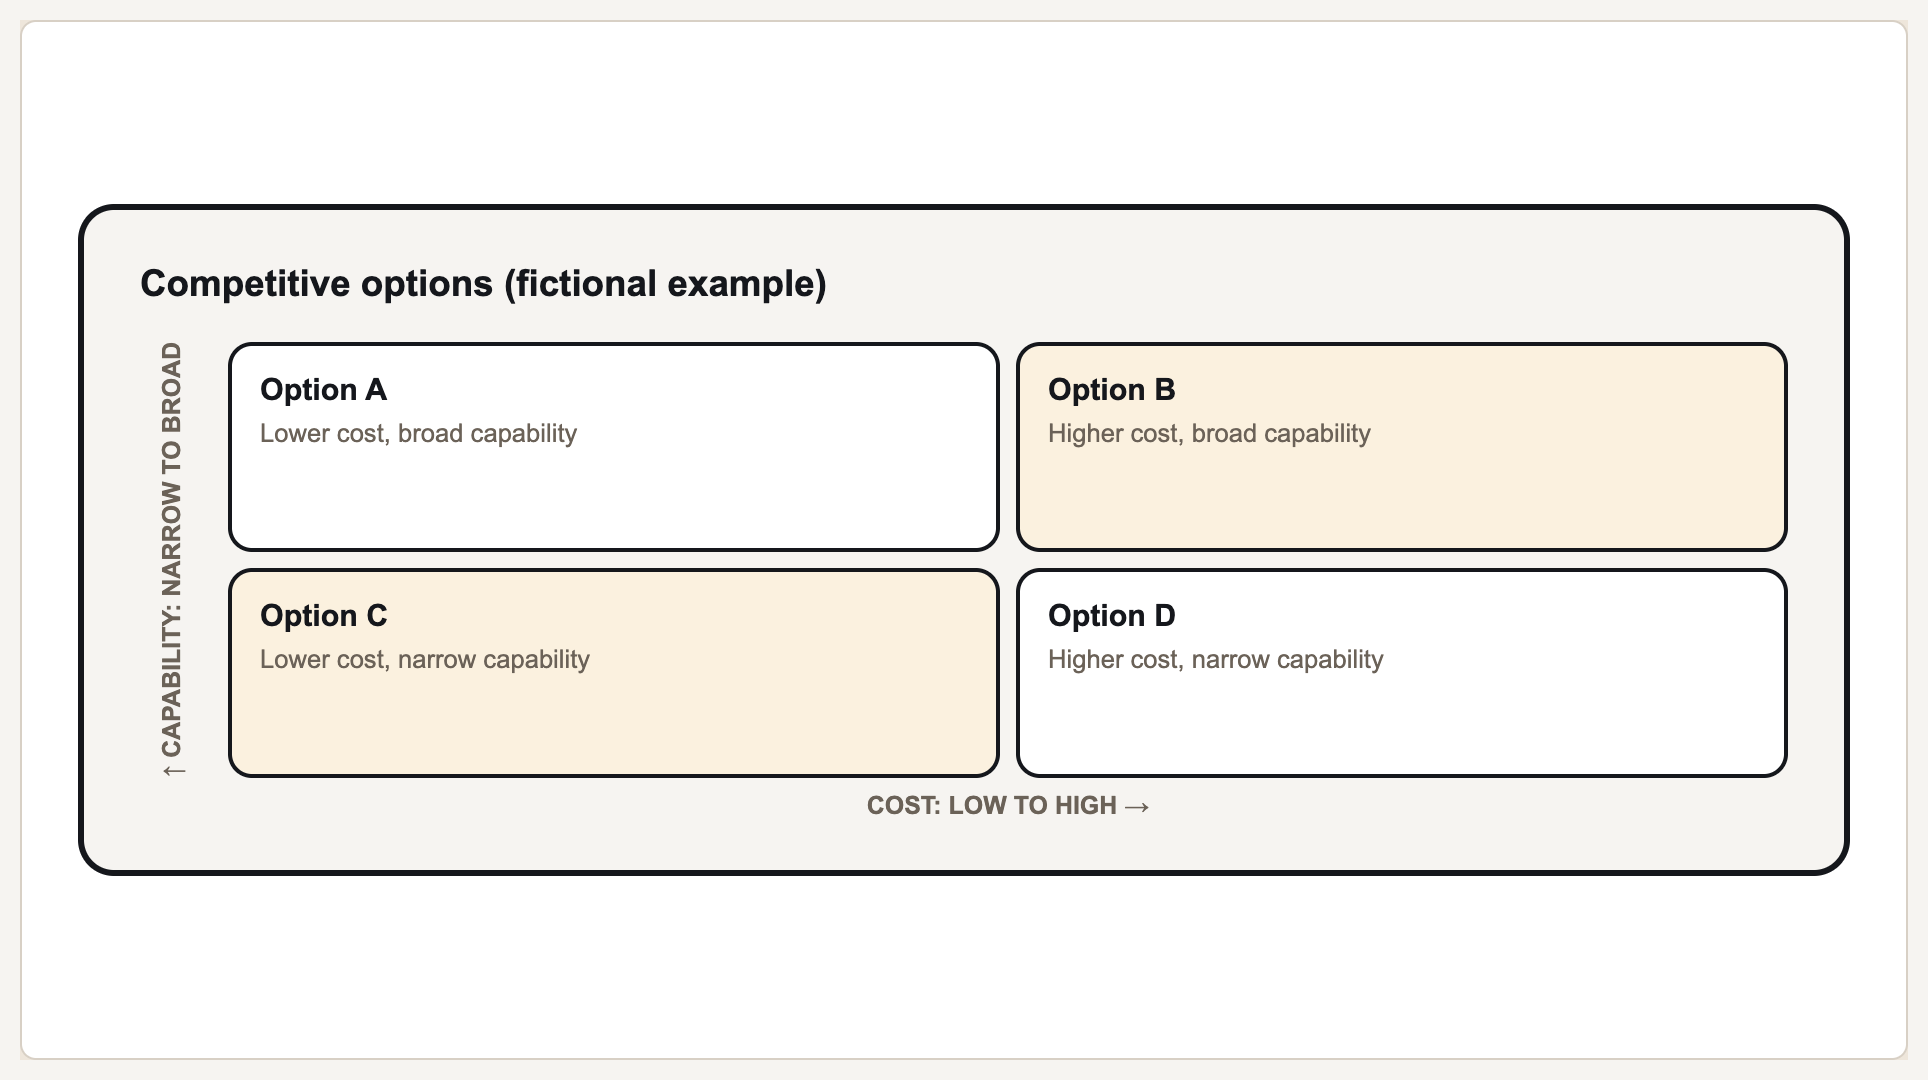
Define cost from low to high and capability from narrow to broad, then place each option in a reviewed quadrant. This example uses four fictional options.
Cost: low to high
Capability: narrow to broad
Option A | Lower cost, broad capability | Quadrant: tl
Option B | Higher cost, broad capability | Quadrant: tr
Option C | Lower cost, narrow capability | Quadrant: bl
Option D | Higher cost, narrow capability | Quadrant: br
Review before sharing: Confirm the meaning and direction of both axes. Replace fictional option names and judgments with dated evidence from your comparison.
Prism draws the placements you assign. It does not research competitors, score them or establish which option is best.
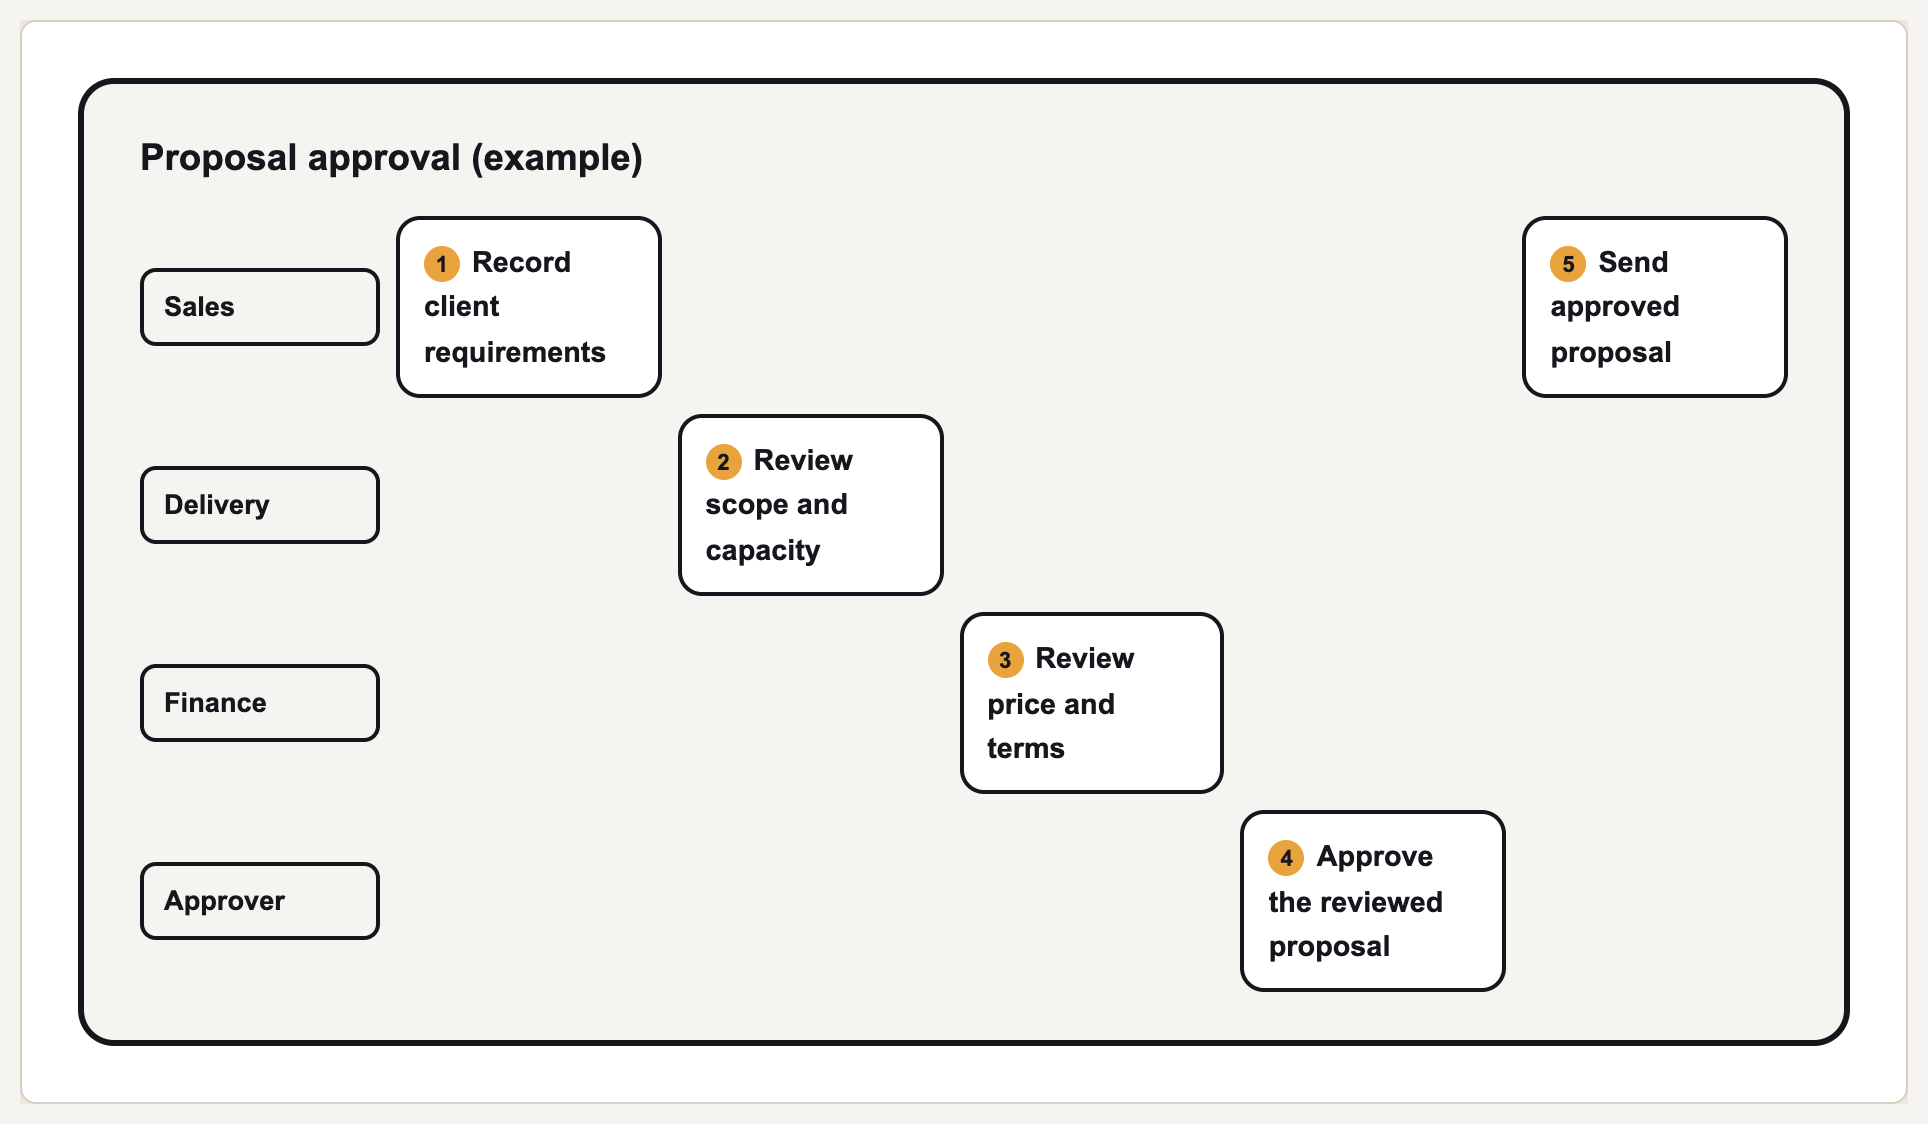
Assign each step to Sales, Delivery, Finance or Approver to show the handoff from requirements to an approved proposal. The prepared example has five steps.
Proposal approval (example)Prepared input
Sales | Record client requirements
Delivery | Review scope and capacity
Finance | Review price and terms
Approver | Approve the reviewed proposal
Sales | Send approved proposal
Review before sharing: Confirm every lane's owner, the order of reviews and what happens if a reviewer asks for changes. Adapt the linear starter to your actual policy.
This starter illustrates the successful approval path. It does not implement approval permissions or automate the workflow.
These are rendered Prism outputs, not decorative mockups. The labels and numbers come from structured
inputs, so the same visual can be revised when the client changes an assumption.
Board KPI chart
Quarterly values stay exact, and in PPTX a bar chart like this one arrives as a native PowerPoint chart with its numbers in an embedded workbook.
Prioritization matrix
Canva Sheets supports CSV/XLSX data, editable linked Magic Charts and bulk brand designs. Some data connector features require Business or Enterprise access. Compare the actual source-update and export workflow rather than assuming a manual-only canvas. Canva official workflow (checked 11 October 2026).
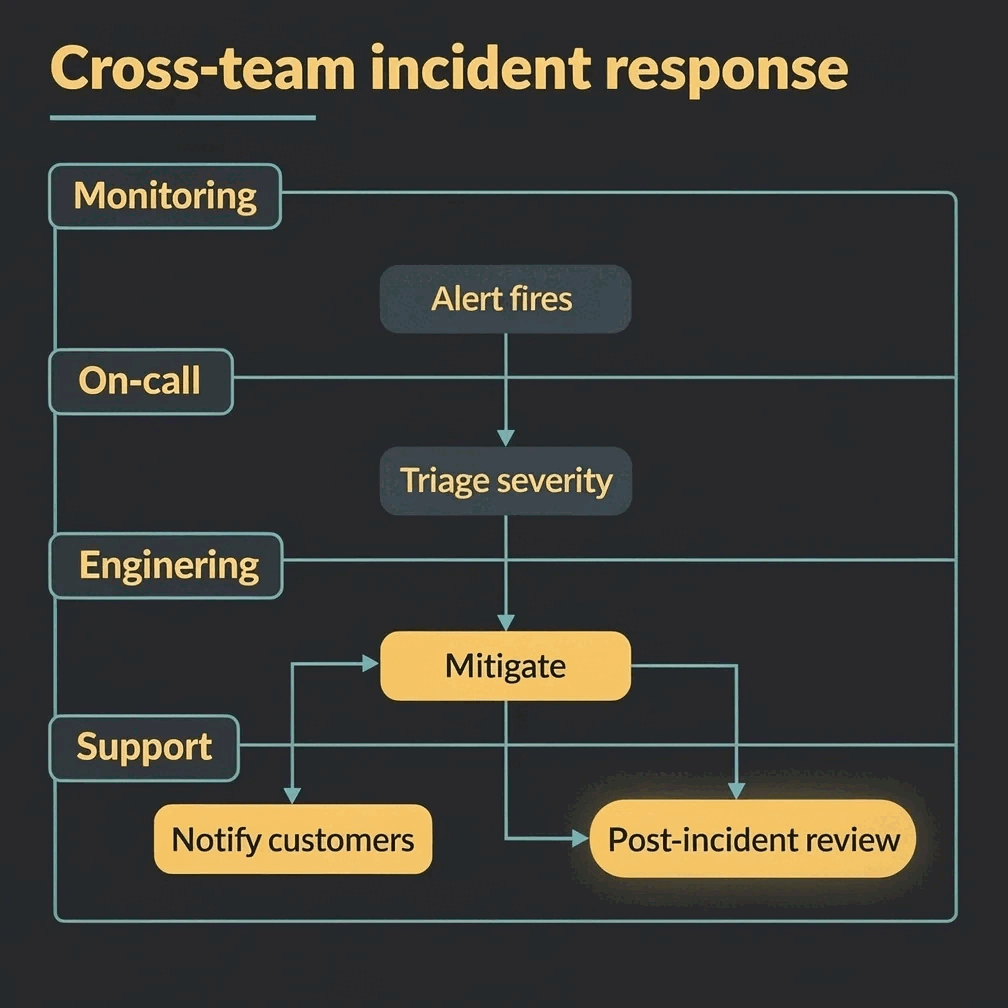
Cross-team swimlane
Keep actors, handoffs, and exact step labels readable in one deterministic flow.
ROI stat card
Carry a headline number and its context into the proposal, memo, or executive deck.
Where Prism fits in the consulting workflow
Consultants already write the argument, model the economics, and present the recommendation.
Prism turns the proof points into exact visuals so the client can inspect the data without wondering
whether an image model redrew it.
Arc proposal
Shape the scope, problem statement, workplan, and commercial story before the client says yes.
Prism proof visuals
Render the BCG matrix, KPI trend, intake flow, ROI stat, and risk callout from the actual inputs.
Lumen deck
Carry the same exact visual into the executive narrative, with the brand and source material intact.
The first template library
The Prism maker tools now include consultant framework starters: board KPI trend, market mix donut,
pipeline conversion, BCG-style portfolio matrix, advisory value chain, maturity pyramid, client intake flow,
workstream swimlane, ROI stat, executive quote, and risk callout.
The deterministic makers export the same structured visual as HTML, SVG, PNG, PDF, or PPTX.
In the PPTX, bar, horizontal bar, stacked bar, line, area, pie, donut, scatter, radar, and bar-and-line combo charts arrive as native PowerPoint charts with their numbers in an embedded workbook that Edit Data opens; waterfall, funnel, Gantt, heatmap, treemap, symbol map, Marimekko, bubble, Sankey, bullet, slope, and dumbbell charts arrive as editable PowerPoint shapes and text, as does any chart PowerPoint cannot draw the way Prism does, such as a pie with a negative slice or an area chart with a missing value. Diagrams, flowcharts, and cards arrive as native, selectable PowerPoint shapes.
Review and markupUse PNG or PDF for a stable client-review artifact.
Continue in the deckUse PPTX — bar, horizontal bar, stacked bar, line, area, pie, donut, scatter, radar, and bar-and-line combo charts arrive as native PowerPoint charts, and everything else as native, selectable PowerPoint shapes.
Embed or reuseUse self-contained HTML or SVG in portals, documents, and web workflows.
From source to slide
1. QualifyUse Arc to frame the opportunity and proposal.
2. ModelPaste data into Prism templates instead of redrawing charts.
3. RenderExport HTML, SVG, PNG, PDF, or PPTX from the same structured request.
4. PackageMove the visual into Lumen for the client deck.
5. ShareCopy an embed for a portal, memo, or client workspace.
A reporting dashboard with a deliberate next period
Combine saved charts, diagrams and cards into a reporting dashboard or visual story. Prism pins the accepted source revisions and keeps introductions, captions and order alongside them. A later child revision becomes a review candidate, so a shared dashboard keeps its published snapshot until you republish it.
Use public-source snapshots or selected Business calculation metrics for recurring reporting, and reusable templates for CSV batches. Review mappings, source warnings and each proposed period before accepting changes. This is a bounded visual reporting workflow, not unrestricted BI exploration or a private database connector.
Export the format the next workflow needs. Compatible individual charts can carry editable PowerPoint data; other supported maker visuals use selectable shapes and text. Generated infographic, framework and decision images remain image outputs with separate source-field editing.
More from Gixo
Keep exploring
Cookie
We value your privacy
We use cookies to improve the product, measure site usage, and keep settings in sync.
Choose which categories you want to allow.