
Gixo Prism · User guide
Everything you need to make charts, diagrams and infographics in Prism
Exact charts, diagrams, flowcharts and cards drawn from what you type, AI infographics and frameworks from your own material, and campaign images sized for every channel, with a link to each screen.
Start here
What Prism is
Prism makes business visuals in two different ways, and it helps to know which one you're using.
Visual packs are the third part of Prism: campaign images cut to the right size for social posts, web pages, email and print, with your headline and logo laid over them.
Your Prism dashboard
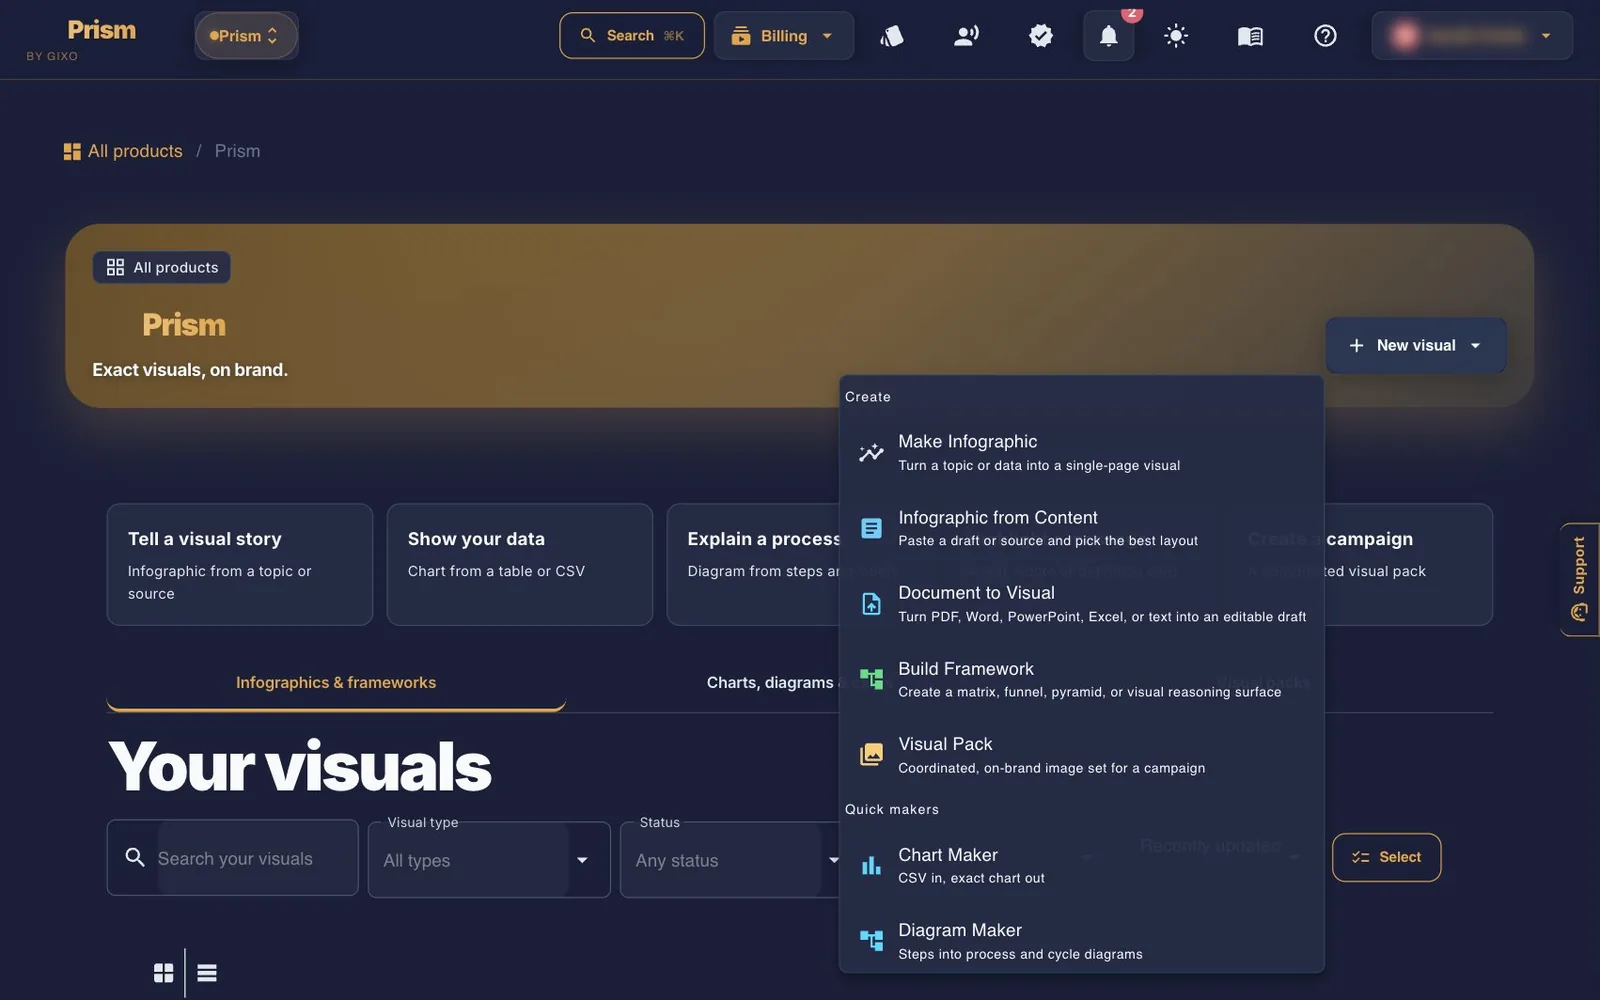
New visual at the top opens two groups. Create has Make Infographic, Infographic from Content, Document to Visual, Build Framework and Visual Pack. Make Infographic and Infographic from Content open the same page. Quick makers has the Chart, Diagram, Flowchart and Card makers and Data & Scale. Below it, a row of shortcuts covers the common jobs: Tell a visual story, Show your data, Explain a process, Highlight a message and Create a campaign.
Your work sits in three tabs:
- Infographics & frameworks. Search, filter by type and by status (Ready, Making now, Needs attention), and sort by when you last updated or created them. You can rename or duplicate a card, and Select lets you move or delete several at once.
- Charts, diagrams & cards. The visuals you've saved from the makers. This is your visual library, described below.
- Visual packs. Your campaign images, with the format and date on each pack.
Making an infographic
An infographic starts from a brief and, if you like, your own material. It takes three steps on one page, and only the last one uses plan capacity.
1. Define Brief
Answer What should this infographic explain? That's enough to continue. Open Refine output to shape the result:
| Setting | Choices |
|---|---|
| Audience | Who it's for, in your own words. Leave it blank and Prism writes for a general professional audience. |
| Output use case | Social feed (4:5, the default) · Story / mobile (9:16) · Deck slide (16:9) · Document / report (long-form) · Blog / embed (long-form) · Internal one-pager (4:5) |
| Style family | Executive consulting · Modern SaaS (the default) · Editorial report · Startup pitch · Data journalism · Minimal monochrome · Bold social media · Education / explainer · Corporate presentation · Premium magazine |
| Detail level | Quick · Balanced (the default) · Detailed |
Tick Use custom brand colors to set the accent, text and background colours for this infographic. Saved Brand Kit colours need a Business plan or higher.
To work from your own material, use Upload Files (up to 10 files: PDF, Word, text, CSV, Excel or images, 500 MB each and 2 GB in total), Paste Text, or From Content to pick a document already in Gixo. There's no field for a web address, so paste the page's text instead.
2. Analyze & Choose Layout
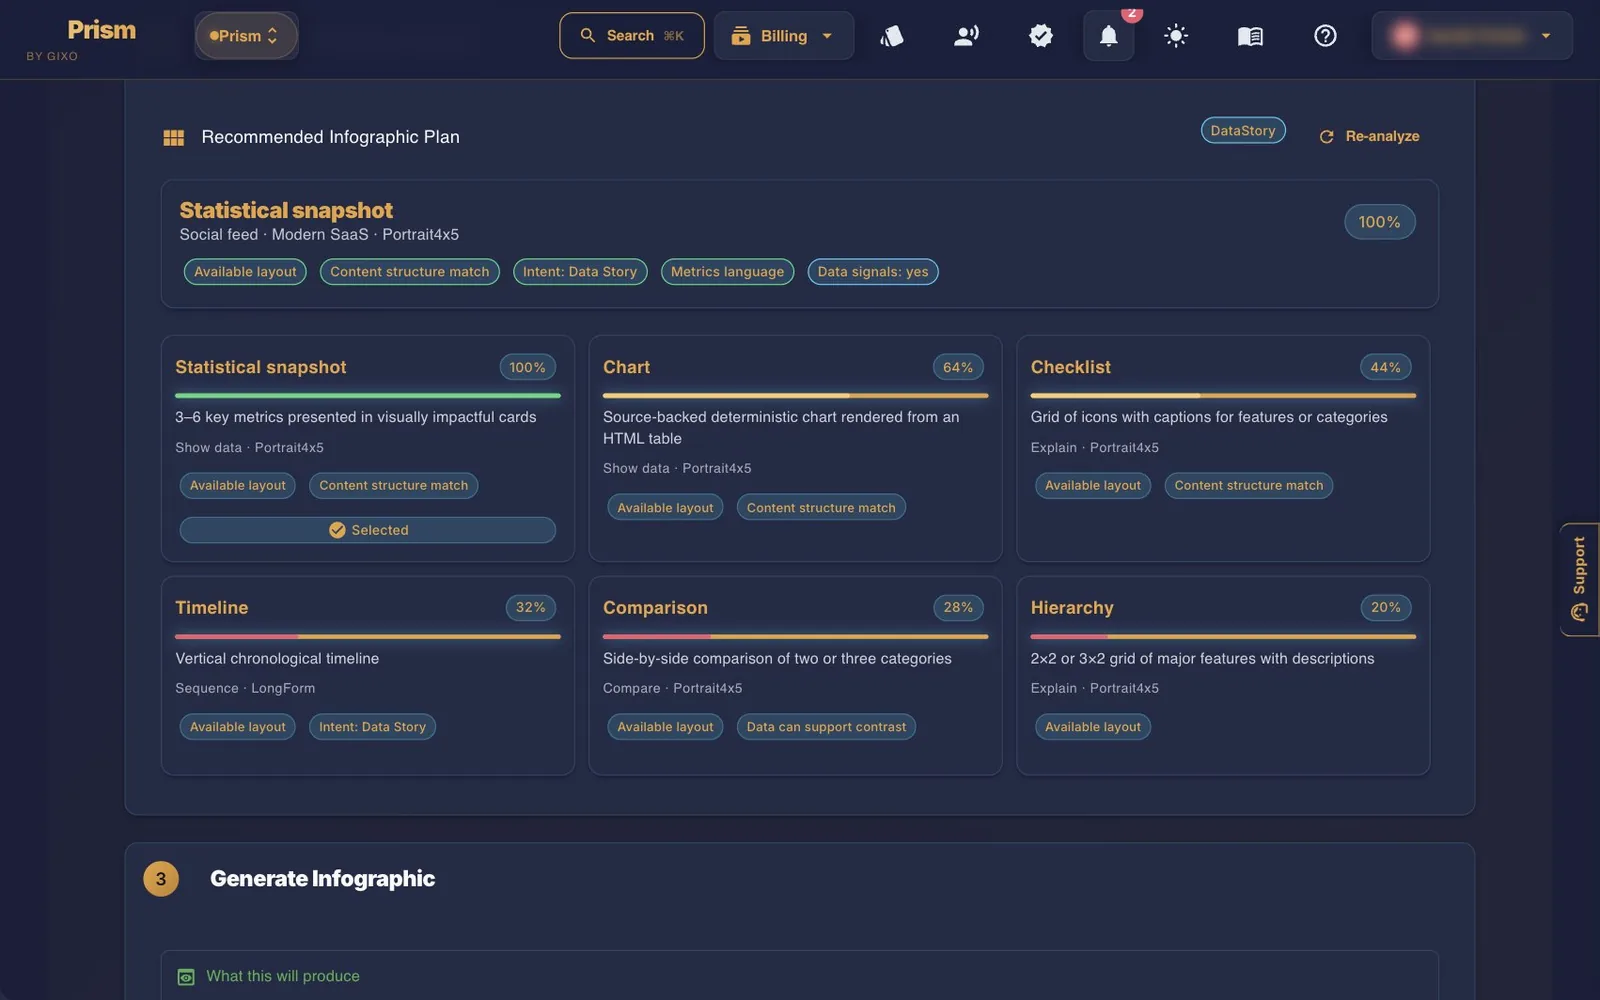
Click Analyze Content & Find Best Layouts. Prism scores your content against up to nine layout families, such as a statistical snapshot, comparison, process, timeline, chart, list or quote, and recommends one, showing a match score on each. The Chart layout is offered only when your content has numbers or a table. Scoring uses no plan capacity, so you can change the use case or style and re-analyze as often as you like.
3. Generate Infographic
What this will produce sums up the structure, use case, style, shape and detail level. Click Generate Infographic. It uses plan capacity and can take a minute. You can leave the page while it works, and the finished infographic opens in its own viewer.
In the infographic viewer
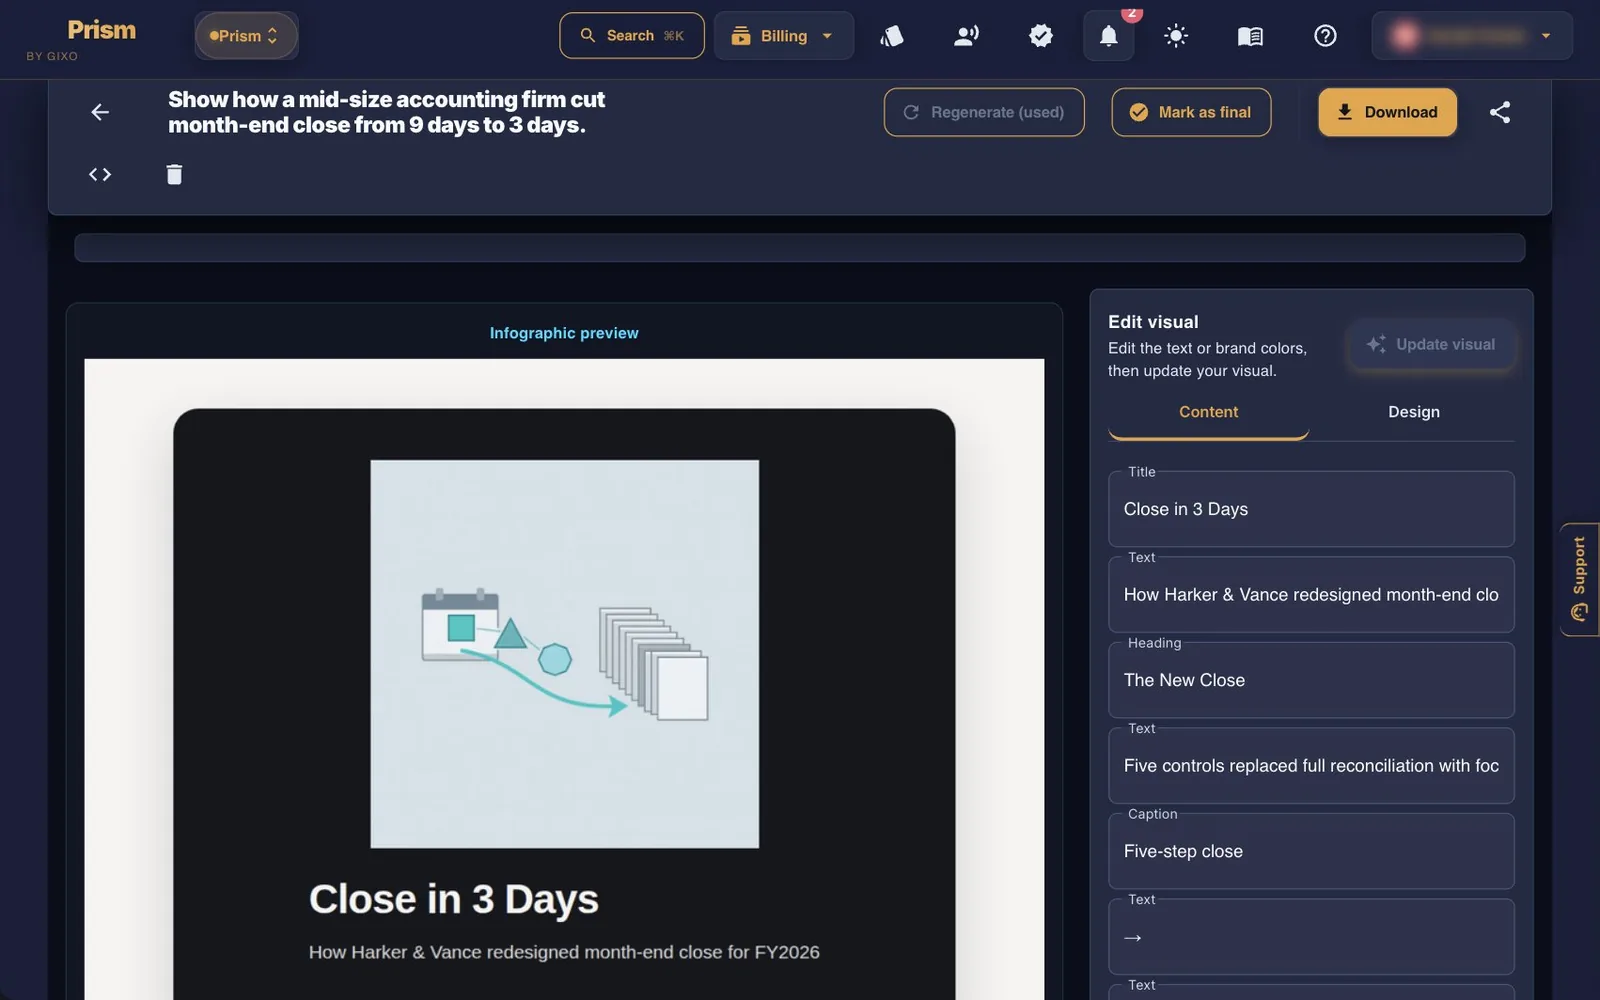
- Regenerate (1×) makes one alternative with the same style and layout rules. Each infographic gets one, and it uses plan capacity like a new infographic.
- Mark as final confirms the version you'll use. It stays saved in the viewer.
- Download offers Download PNG, Export Feed PNG (4:5, 1080 × 1350), Export Story PNG (9:16, 1080 × 1920), a Feed + Story ZIP and Export HTML. Infographics download as PNG and HTML, with no watermark.
- Edit visual lets you change any piece of text, or the brand colours on the Design tab, then click Update visual. The current version stays in place until the new one is ready.
- Logo adds one corner logo from an image address, or your saved logo on Business and up, in any of the four corners.
- Image position and size lets you move, resize, rotate, flip or fade the image, then Save visual.
- Show sources lists the material the infographic was made from.
- Share creates a public link, on any plan including the trial, or shares the infographic with named people from Professional up. People you share with as View only can see it but can't download it.
Read it through before you publish
AI writes an infographic's wording and Prism draws exactly what it wrote, so check names, numbers and claims against your source. When every figure has to be exact, make the chart in Chart Maker instead.
Building a framework
A framework is a one-page thinking tool, such as a 2×2 matrix, a funnel, a flywheel or a maturity model. AI writes it from your material and Prism draws it. It takes three steps.
- Add ContentUpload files (the same limits as infographics), paste text with a Framework Title of up to 100 characters, pick a document From Content, or use Manual Entry: a short title of four to six words plus the context, meaning the key elements, relationships and categories.
- Choose Framework LayoutPick from 24 templates, searchable and filtered by visual job. There are 14 framework layouts: 2×2 Matrix, 3×3 Matrix, Pillar Model, Funnel, Flywheel, Layered Stack, Value Chain, Capability Map, Maturity Model, Venn Diagram, Concentric Circles, Hierarchy Tree, Balance Scale and Pyramid. The other 10 are diagram presets built on the same shapes, such as a process flow and a cycle. Custom brand colours work here too.
- Configure & GenerateChoose how strict the layout should be: Canonical (an exact structure, as in a SWOT), Evaluative (uniform, for comparison), Standard (balanced, the default) or Flexible (allows asymmetry). Then click Generate Framework. It uses plan capacity and runs in the background, so you can leave the page.
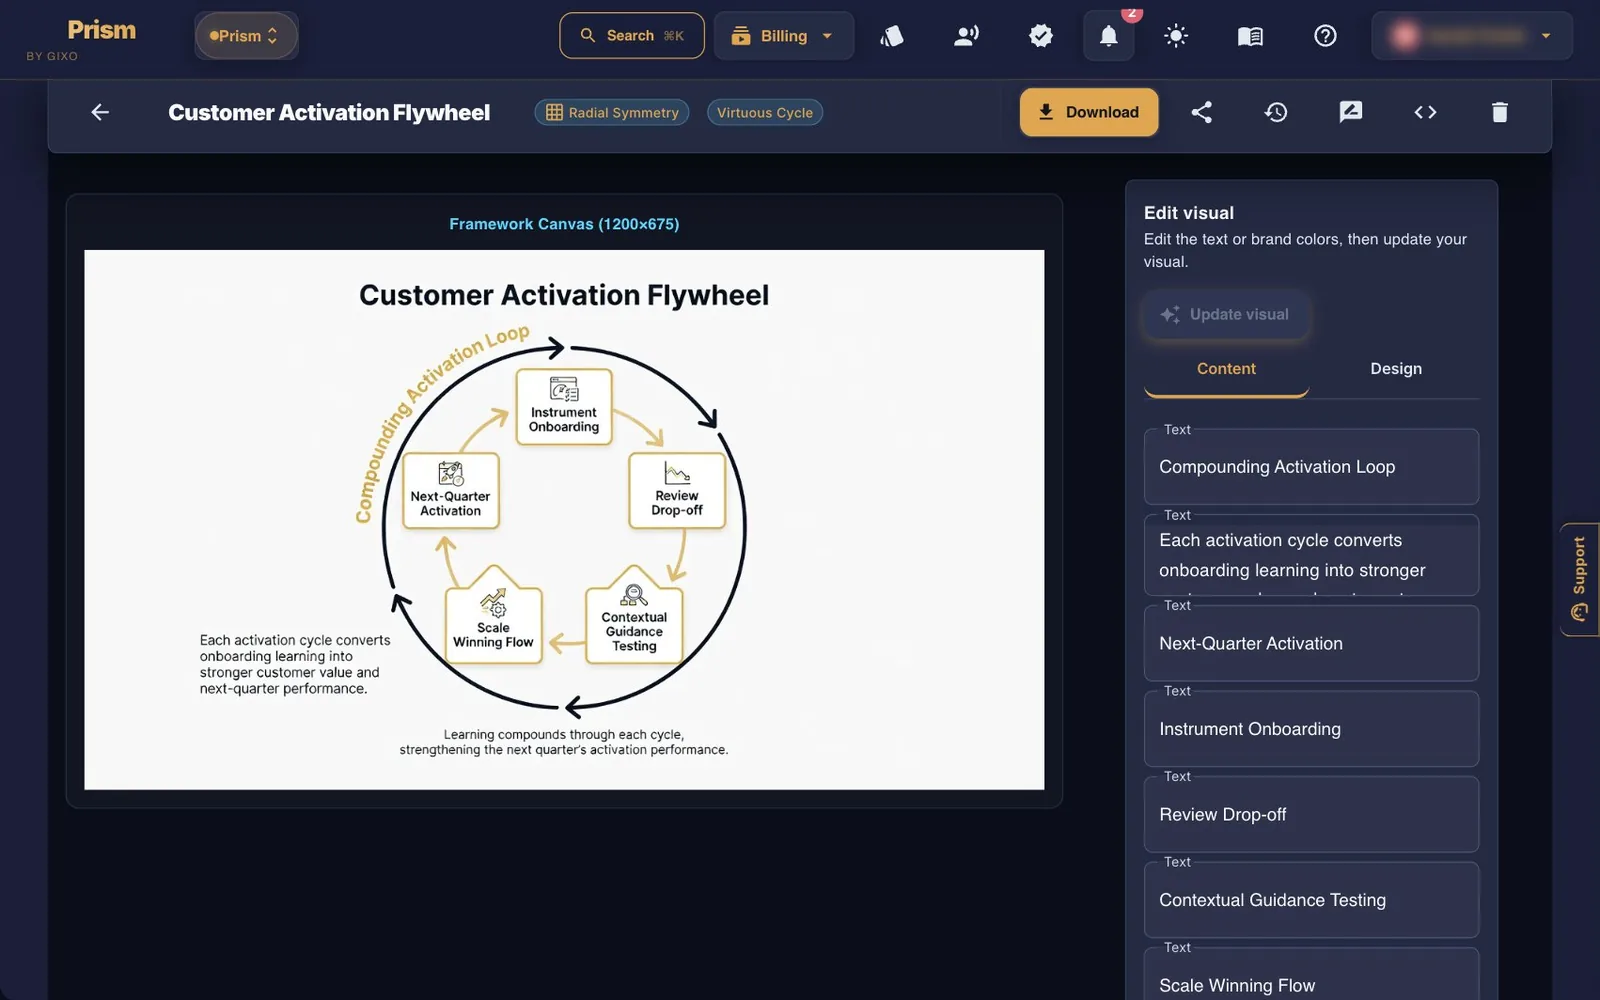
When it's done, you can View Framework, Regenerate or Create Another. That screen is the only place to regenerate, so decide there. The framework viewer has Download (Export PNG for the owner and Export HTML), Version history, Reviews and collaboration, and the same Edit visual and Logo panels as infographics.
The Chart, Diagram, Flowchart and Card makers
The four makers draw exactly what you enter, and none of them uses AI. Anyone can use them without an account, and they're also in the dashboard's New visual menu. To see how one works, open Start from an example, which fills in the form without making anything.
| Maker | What you give it |
|---|---|
| Chart Maker gixo.ai/tools/chart-maker | A table: paste CSV, where the first column is the category and the rest are numbers, or upload CSV, TSV or Excel. There are 16 chart types, or Auto (pick for me): bar, horizontal bar, stacked bar, line, area, pie, donut, scatter, radar, waterfall, funnel, Gantt, bar + line combo, heatmap, treemap and symbol map. |
| Diagram Maker gixo.ai/tools/diagram-maker | One item per line, in one of 11 shapes: process / steps, cycle / loop, pyramid, funnel, tree / hierarchy, pillars, 2×2 matrix, Venn, concentric rings, layered stack, or a graph with the connections you define. |
| Flowchart Maker gixo.ai/tools/flowchart-maker | Step, decision and outcome rows, up to 200, drawn as a decision flow or as a swimlane across the people or teams involved. |
| Card Maker gixo.ai/tools/card-maker | A stat (one big number), a quote, a callout or note, or a definition. |
Chart Maker in detail
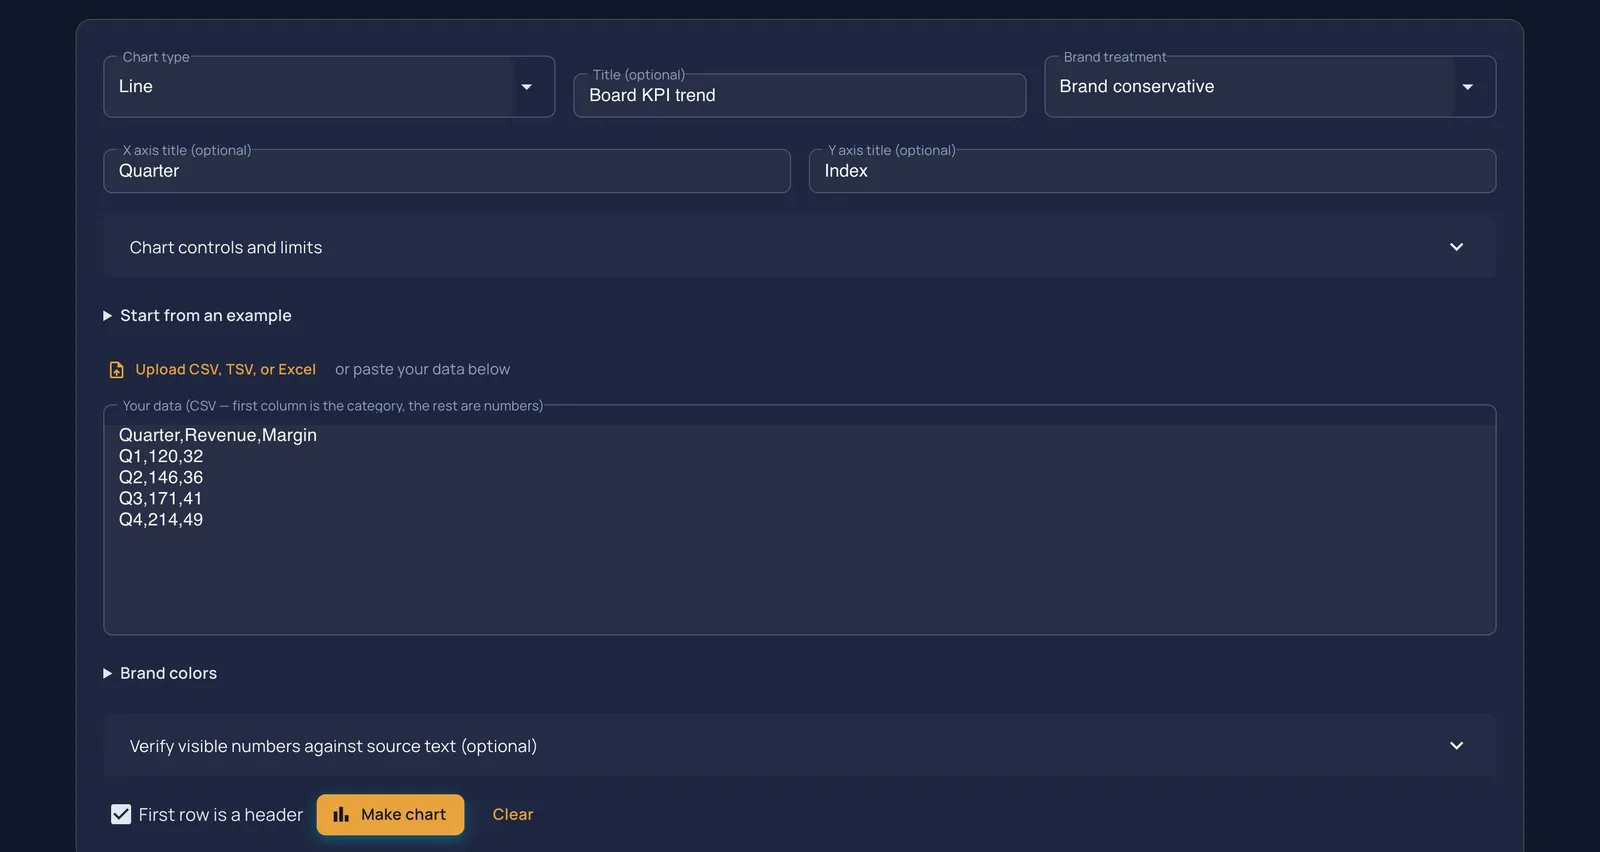
- Chart controls and limits. Category order, 1–20 categories (8 to start), 1–8 series (4 to start), the number format (auto, number, currency or percent), 0–2 decimal places, and whether to show the legend, data labels and grid lines. If anything is trimmed, or a cell can't be read as a number, the result says so.
- Uploads. Text files up to 2 MB. Excel workbooks up to 5 MB are read from the first sheet, up to 500 rows and 30 columns. Formulas and macros are never run: Prism reads the values the workbook saved. A symbol map needs Location, Latitude, Longitude and Value columns, because Prism doesn't look places up.
- Colours. Brand treatment has four presets: Conservative, Bold, Brand conservative (the default) and Brand bold. Or open Brand colors and enter your own.
- Checking the figures. Paste the passage the numbers came from into the optional source-text panel. Prism compares the numbers shown in the chart with it and lists any that don't match. It doesn't fact-check the surrounding prose.
- After you click Make chart. Change the content in the editor and click Apply changes, or open Advanced canvas editing to drag, align, group, layer or hide objects.
Taking a visual with you
| Who | What you can do |
|---|---|
| Anyone, no account | Make and preview any visual. Copy or download it as HTML or SVG, with a small linked “Made with Gixo Prism” credit. |
| A Prism trial or plan | Clean HTML and SVG with no credit, plus PNG, PDF and PowerPoint. Save to Prism keeps the visual in your library, where you can reopen it and see its version history. |
The PowerPoint file is built from native, selectable shapes, so you can change labels and colours in PowerPoint. A chart arrives as shapes, not as a PowerPoint chart with editable data.
Try an AI-designed version, available when you're signed in with a trial or plan, lays the same numbers out as a finished, designed image next to the exact version. It uses plan capacity, takes about a minute, and makes one design a minute. The image model paints the text, so check it for typos.
Your visual library
The visual library is the dashboard's second tab. You can search it, filter by charts, diagrams, flowcharts, cards and compositions, import a Prism JSON or Mermaid file, and compose a visual story from it.
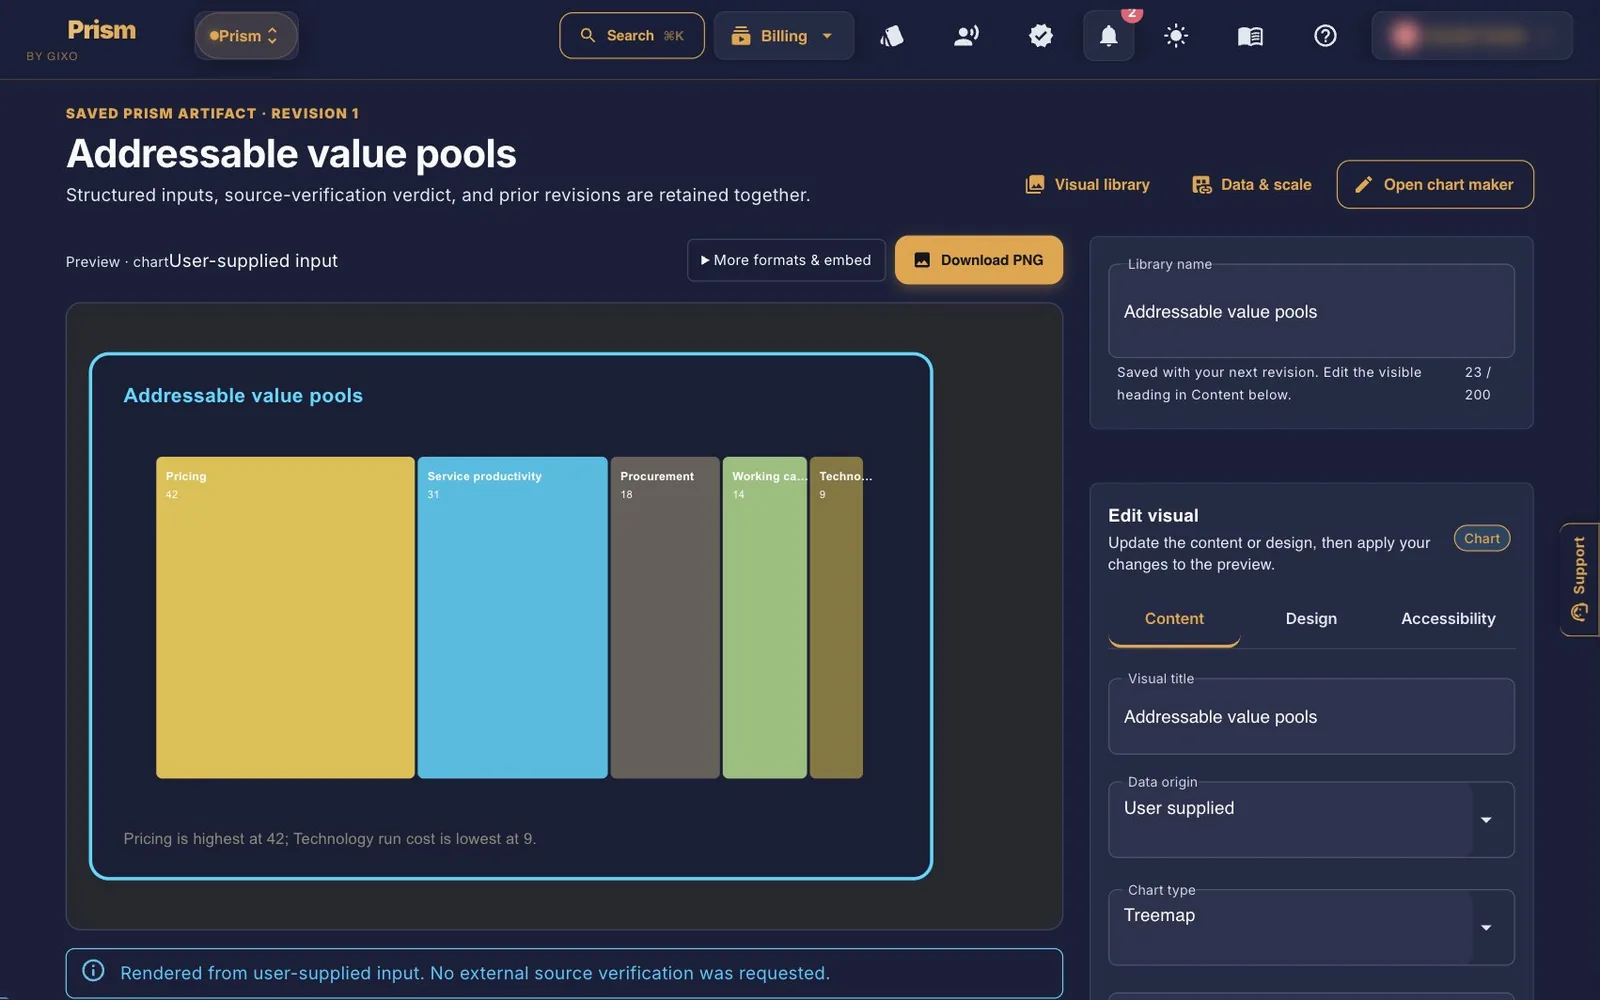
Each saved visual opens in its own workspace, labelled with its revision number:
- Downloads. PNG, plus HTML, SVG, PDF and PowerPoint under More formats & embed. You also get the structured JSON, the source CSV for a chart, and Mermaid for a flowchart, as well as Copy HTML and Copy Embed for web pages.
- Refine with AI. Choose a mode (executive clarity, concise labels, visualization fit or accessibility copy), say what you want changed, then accept or discard each turn. Accepting saves a new revision. It uses the AI assists included with your plan.
- Connected data. Link a chart to a public CSV file, a JSON API, a published Google Sheet or a public Excel workbook. It refreshes when you click, or every 15 minutes, hourly, every 6 hours or daily while the visual is open. Each refresh keeps a snapshot and makes a new revision.
- Save as a reusable template. Keeps the structure, styling and layout, but not the text or the data connection.
- Publish and share. Publish a stable review link and a responsive embed, and invite guest reviewers with time-limited links. You can revoke any of them. The public copy leaves out your source text, edit inputs, name and history.
- Comments and version history. Comment, reply and resolve. You can restore any earlier revision without losing the current one.
Visual stories
Compose visual story puts 2 to 12 saved visuals on one page. Choose a layout: Editorial (one visual per row), Grid, Dashboard or Story. Then add an introduction and alternative text. Prism fixes the revision of each visual it uses, so a published story doesn't change when you edit a visual later. gixo.ai/prism/compositions/new
Data & Scale
The Data sources tab lists every connected chart, with Refresh now. Templates holds your reusable templates. Batch creation maps the rows of a CSV onto a template and creates up to 50 visuals at once. Batches are drawn by code, not AI, so they use no plan capacity. gixo.ai/prism/data-workspace
Document to Visual
This turns a document into an editable chart, diagram, flowchart or text card. It doesn't make infographics. Upload up to 5 files, 5 MB each: PDF, Word, PowerPoint, Excel, CSV, TSV, Markdown or text. Pick a preferred visual or let Prism choose, and say what it should emphasize. Prepare visual draft needs a trial or plan and uses an AI assist. Nothing is saved until you've reviewed the draft. When the figures come straight from your data, the review screen says that no figure was written by the model. Adjust the draft, then click Save visual and open editor.
Visual packs
A visual pack is a set of images for one campaign, each cut to the size its channel needs. There are two ways to start one.
In the pack workspace
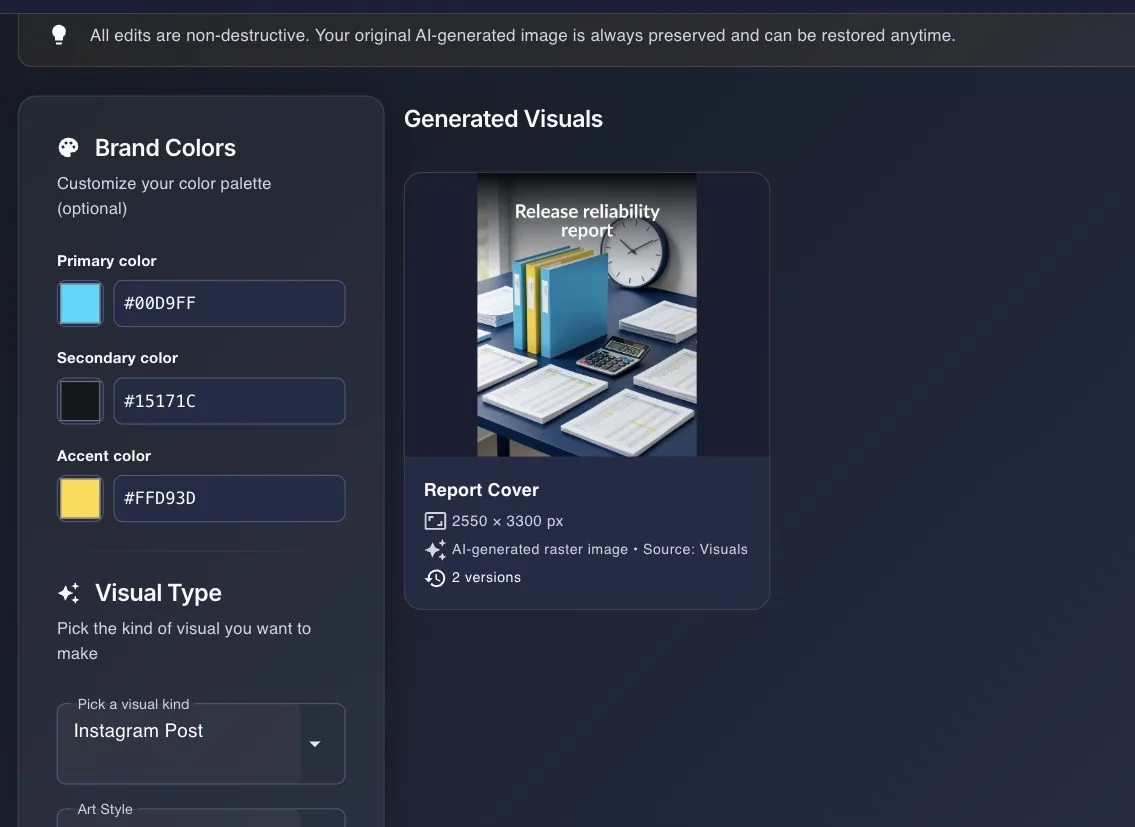
Pick a Visual Type, an Art Style (Photorealistic, Editorial Illustration, Watercolor or Minimal Line Art) and, if you like, brand colours. Then say what the image should show. If you leave that blank, Prism uses the document. A Campaign seed replays a look you liked, and Match an existing visual keeps new images consistent. Generate Visual makes one image and uses plan capacity. If you already have a photo, click Use my image instead.
| Group | Formats (pixels) |
|---|---|
| Social | Instagram Post and Carousel Slide (1080 × 1080) · Instagram Story and TikTok Cover (1080 × 1920) · LinkedIn Post (1200 × 627) · X (Twitter) Post and YouTube Thumbnail (1536 × 864) |
| Web, email and slides | Hero Image, Presentation Cover and Web Section Background (1536 × 1024) · Email Header (2048 × 1024) · Display Ad (728 × 90) |
| Event Poster and Flyer (A4 at 300 dpi) · Report Cover (US Letter at 300 dpi) |
- On each image: Full Preview, Add Branding, Use my own image, Animate (free), Download as WebP, PNG or JPG, Copy the image link, HTML or Markdown, and Delete. Copied links are public, so anyone who has one can see the image.
- Animate makes a 2–12 second MP4 clip. The link lasts six hours and the clip isn't saved, so download it straight away.
- Add Branding has seven designs: Clean Brand, Editorial, Bold Announcement, Product Spotlight, Corporate Proof, Quote and Key Stat. There are five finishes: Natural, Crisp, Warm, Cinematic and Brand Monochrome. Add a headline of up to 16 words and an optional supporting idea of up to 26, plus a logo on non-social formats. Prism lays the words and logo over the image rather than asking AI to paint them. Every save is a version you can compare or restore, and the original image is always kept.
Prism inside your other Gixo products
- In the editor. In a Quill article, an Arc proposal, a Folio chapter or a Lex document, select text and click Insert Prism visual in the toolbar. Lex also has a Prism button above the document. Choose a diagram, flowchart, text card or chart, describe it (for a chart, paste CSV or TSV data), then insert the result. Each visual uses one of the AI assists included with that product's plan, so you don't need Prism for this.
- In Lumen. The slide editor has Add Prism visual slide, and Insert a saved visual to bring in one from your Prism library.
- From a document. Under Create from this, Infographic, Visual images and Framework open the matching Prism page with the document already loaded.
What needs a plan
| Action | What it takes |
|---|---|
| Making and previewing charts, diagrams, flowcharts and cards | Nothing. No account needed. |
| Maker HTML and SVG with the Prism credit | Nothing. |
| Clean maker files, Save to Prism, publishing, batch creation | An active trial or plan. No plan capacity used. |
| Infographics, frameworks, visual pack images, AI-designed versions | An active trial or plan. Uses plan capacity. |
| Refine with AI, Document to Visual | An active trial or plan. Uses the AI assists included with it. |
| Brand Kit: saved brand colours and logo | Business and up. On any plan you can set colours by hand for each visual. |
Plans and your trial
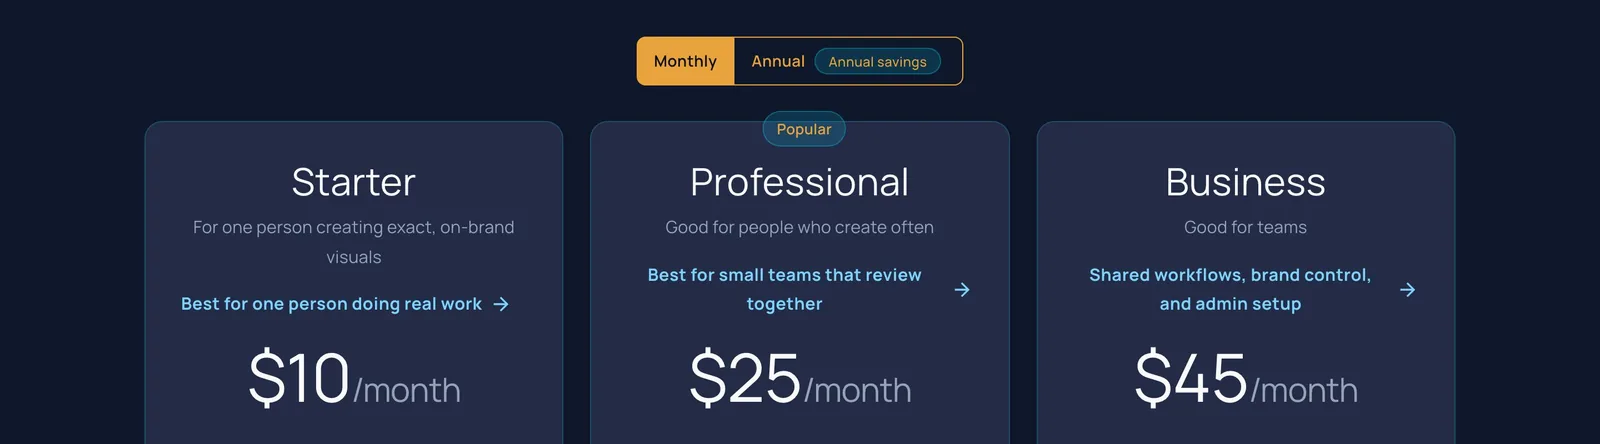
Each Prism plan has one price, in US dollars, and includes a set number of seats. Every plan includes capacity that resets each month, and your subscriptions page shows a usage bar rather than counts.
| Plan | Monthly | Annual | Seats included |
|---|---|---|---|
| Starter | $10 | $90 | 1 |
| Professional | $25 | $250 | 2 |
| Business | $45 | $450 | 5 |
| Enterprise | $99 | $999 | 10, through Azure Marketplace or a private offer |
- Every plan includes infographics, frameworks, visual packs, clean maker files, the visual library, publishing and AI refine. Higher plans add capacity and seats.
- Sharing with named people starts at Professional, and Brand Kit at Business.
- The 14-day trial needs no card, and each email address gets one Prism trial. It works like Starter. When it ends, making and editing visuals and clean maker files pause until you choose a plan.
Free tools, no account needed
Besides the four makers, these tools run without a sign-in and without AI.
| Tool | What it does |
|---|---|
| Chart Palette Contrast Checker gixo.ai/tools/chart-contrast-checker | Checks each series colour against the chart background and its neighbours using WCAG contrast ratios, and suggests fixes that keep the hue where possible. |
| Chart Data Integrity Checker gixo.ai/tools/chart-number-checker | Checks CSV rows for totals, percentage drift, missing values, duplicate labels and series of different lengths. |
| Chart Honesty Checker gixo.ai/tools/chart-honesty-checker | Flags truncated axes, incompatible units, overstated percentages and misleading category order. |
| Waterfall Chart Maker gixo.ai/tools/waterfall-chart-builder | Checks that a starting value, its gains and losses, and the ending value add up before drawing the bridge. |
| Gantt Chart & Timeline Maker gixo.ai/tools/gantt-chart-builder | Turns tasks and dependencies into a Gantt chart with working-day dates and float. |
| Mermaid Flowchart Maker gixo.ai/tools/mermaid-converter | Turns Mermaid flowchart text into an on-brand SVG. |
| RACI Matrix Validator gixo.ai/tools/raci-matrix-builder | Checks that each task has one accountable owner, and flags missing or overloaded responsibilities. |
Tips
- Use a maker when the numbers must be exact, and an infographic when you want a designed layout and have time to read it through.
- Analyze freely. Layout scoring uses no plan capacity, so try a few use cases and styles before you generate.
- Save your regenerate. Each infographic gets one alternative, and a framework can only be regenerated from its success screen.
- Keep Excel data on the first sheet. Chart Maker reads only that sheet.
- Download animations straight away. An animation link lasts six hours.
Quick links
| Prism dashboard | gixo.ai/dashboard/prism |
| Create Infographic | gixo.ai/infographics/create |
| Create Framework | gixo.ai/frameworks/create |
| Document to Visual | gixo.ai/prism/from-document |
| Start a Visual Pack | gixo.ai/visual-packs/create |
| Visual library | gixo.ai/prism/library |
| Compose a visual story | gixo.ai/prism/compositions/new |
| Data & Scale | gixo.ai/prism/data-workspace |
| Chart Maker | gixo.ai/tools/chart-maker |
| Diagram Maker | gixo.ai/tools/diagram-maker |
| Flowchart Maker | gixo.ai/tools/flowchart-maker |
| Card Maker | gixo.ai/tools/card-maker |
| All free tools | gixo.ai/tools |
| Prism plans | gixo.ai/products/visuals#plans |
| Help and support | gixo.ai/support |
Current as of 14 September 2026 and checked against the Prism code. If a screen doesn't match what you see, the product has moved on. Tell us at gixo.ai/support and we'll update this guide.