
Gixo Prism · Visual guide
Graphic Organizer
A graphic organizer is a visual frame that structures thinking: a venn diagram for comparison, a tree for classification, a sequence chart for order, a fishbone for cause and effect, a matrix for two-dimensional comparison. The format is most associated with teaching, but the underlying idea — that a structure makes a kind of thinking easier — is the same reason business documents use frameworks and matrices.
Last reviewed: August 2026
A current Prism output
This is a current deterministic Prism render, generated from structured nodes and labels rather than an image mockup.
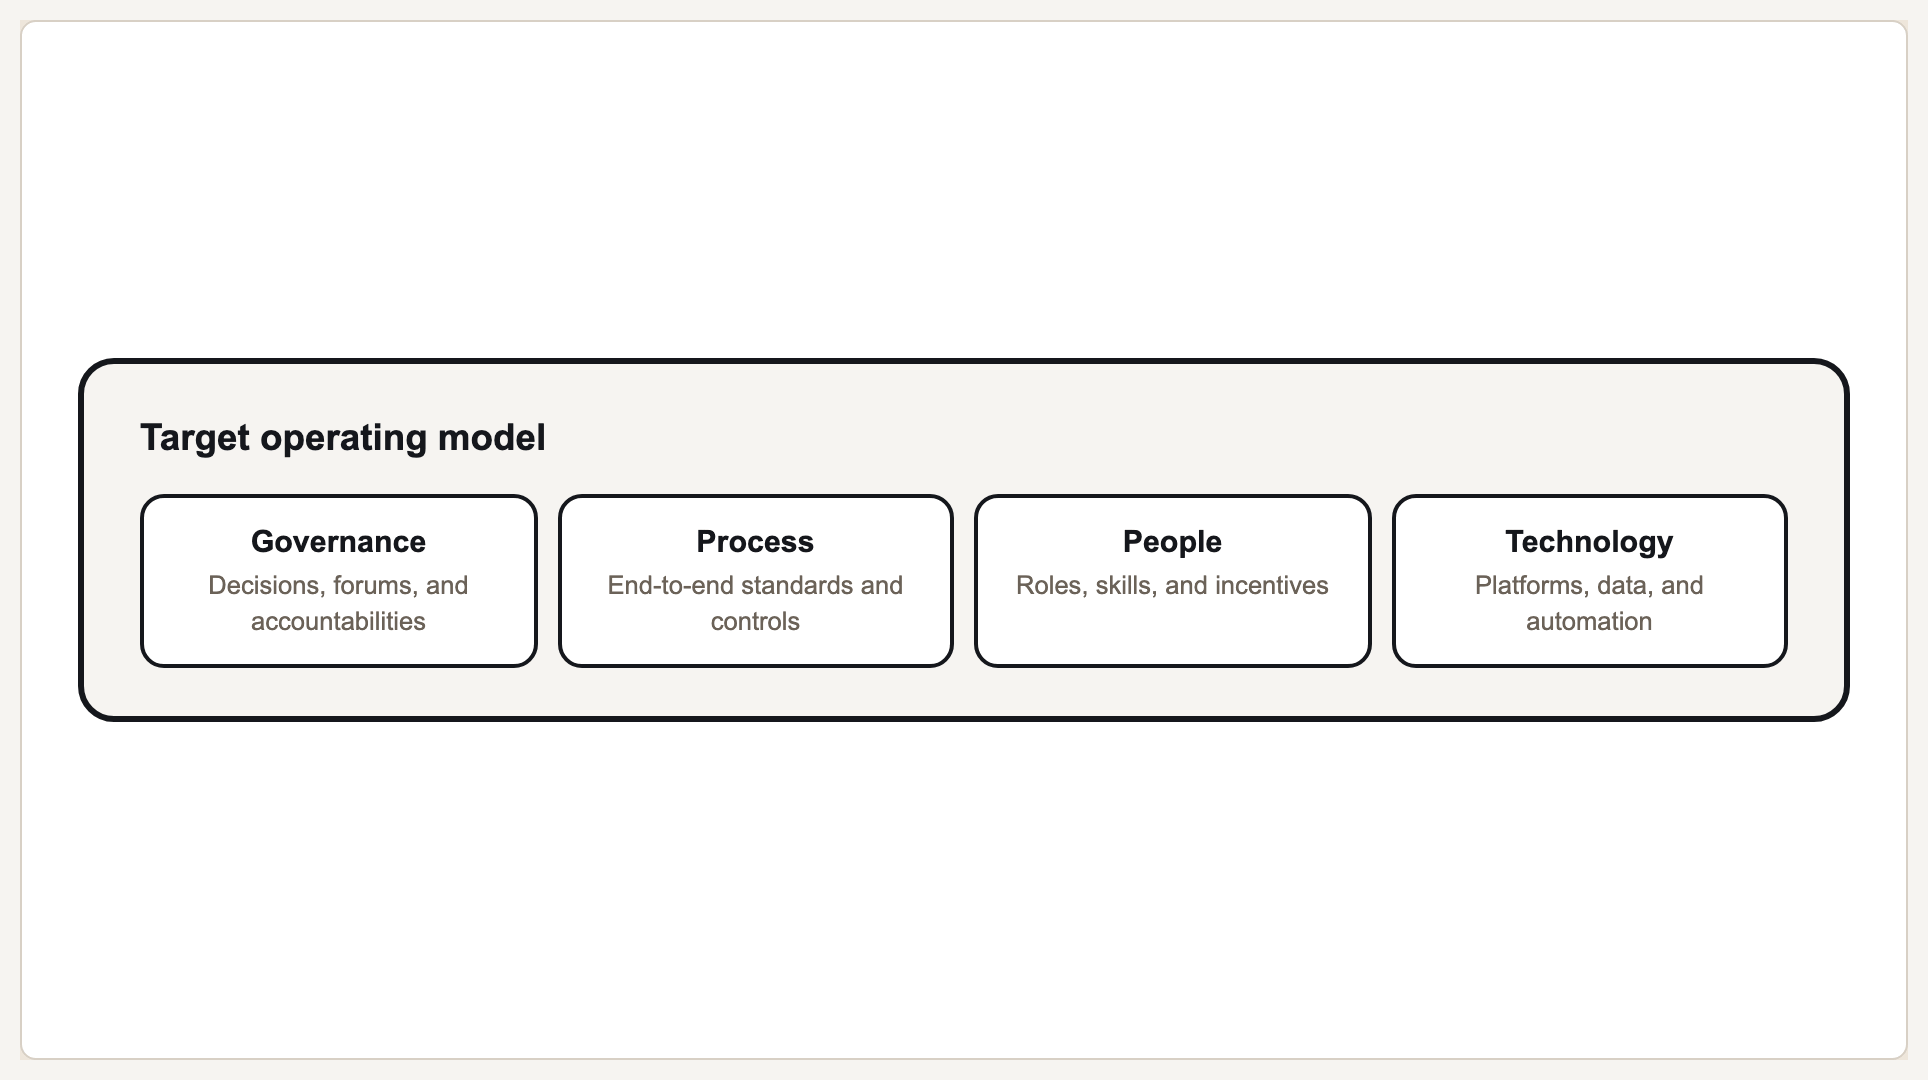
Structure as a thinking aid
A graphic organizer works by constraining. A blank page permits any thought; a venn diagram insists you decide what is shared and what is not. That constraint is the value: it turns a vague instruction like 'compare these' into a set of specific slots that are visibly empty until filled.
This is why organizers are chosen by the thinking task rather than by appearance. Comparison wants overlap, classification wants a hierarchy, causation wants branches converging on an effect, chronology wants a line. Choosing the wrong frame makes the work harder, not just uglier.
The same logic runs through business visuals. A 2x2 matrix, an org chart and a process diagram are graphic organizers with different names — each imposes a structure that makes one kind of reasoning easier and others impossible. Prism's diagram geometries are exactly this set.
Organizer types and the thinking each supports
| Organizer | Supports | Business equivalent |
|---|---|---|
| Venn diagram | Comparing overlap and difference | Venn geometry; positioning maps |
| Tree / hierarchy chart | Classification and decomposition | Org chart; work breakdown |
| Sequence chart | Order and process | Process diagram; roadmap |
| Cause and effect / fishbone | Tracing causes to an outcome | Root-cause analysis |
| Matrix / grid | Comparing on two dimensions | 2x2 quadrant; prioritisation matrix |
| Cycle diagram | Repeating processes | Cycle geometry |
| Concept map | Relationships between ideas | Systems and dependency maps |
| KWL chart | Know, want to know, learned | Pre-mortem and retrospective grids |
Choosing and using one
Name the thinking task
Comparing, classifying, sequencing, tracing causes, or prioritising. The task picks the organizer; the organizer does not pick the task.
Check the frame has empty slots
A good organizer shows you what you have not thought of. If every box fills instantly, the frame is probably too coarse.
Keep one organizer per question
Two questions in one frame produces a diagram that answers neither. Split them.
Convert to a communication visual afterwards
The organizer helped you think. The version other people read may need a different, simpler shape.
What Gixo Prism does here
Prism renders 11 diagram geometries deterministically — process, cycle, pyramid, funnel, tree, pillars, matrix, Venn, concentric, stack and graph. Between them they cover the standard graphic organizers, laid out with consistent spacing and your brand palette rather than dragged into position by hand.
Graphic organizer: FAQ
What is a graphic organizer?
A visual frame that structures thinking — venn for comparison, tree for classification, sequence for order — by turning a vague task into specific slots to fill.
What are the most common types?
Venn diagrams, tree and hierarchy charts, sequence charts, cause-and-effect fishbones, matrices, cycle diagrams, concept maps and KWL charts.
Are graphic organizers only for education?
No. A 2x2 matrix, an org chart and a process diagram are graphic organizers under other names; business documents use the same structures for the same reason.
How do I pick the right one?
Name the thinking task first. Comparison wants overlap, classification wants hierarchy, causation wants converging branches, prioritisation wants two axes.
Render an organizer from your structure
The free diagram maker covers venn, tree, matrix, process, cycle and more, with no account.