
Decision Matrix Maker & Template
List your options, name your criteria, set a weight for each, and score every option — then the free scorecard maker computes the weighted totals and ranks your options for you, with no AI call and no sign-up. Not an empty grid you fill in by hand: a weighted scorecard that does the math, so the winner falls out of the numbers instead of your gut. For a decision drafted from your question and sources, a weighted-scorecard decision page in Gixo Prism computes the totals and the ranking the same way.
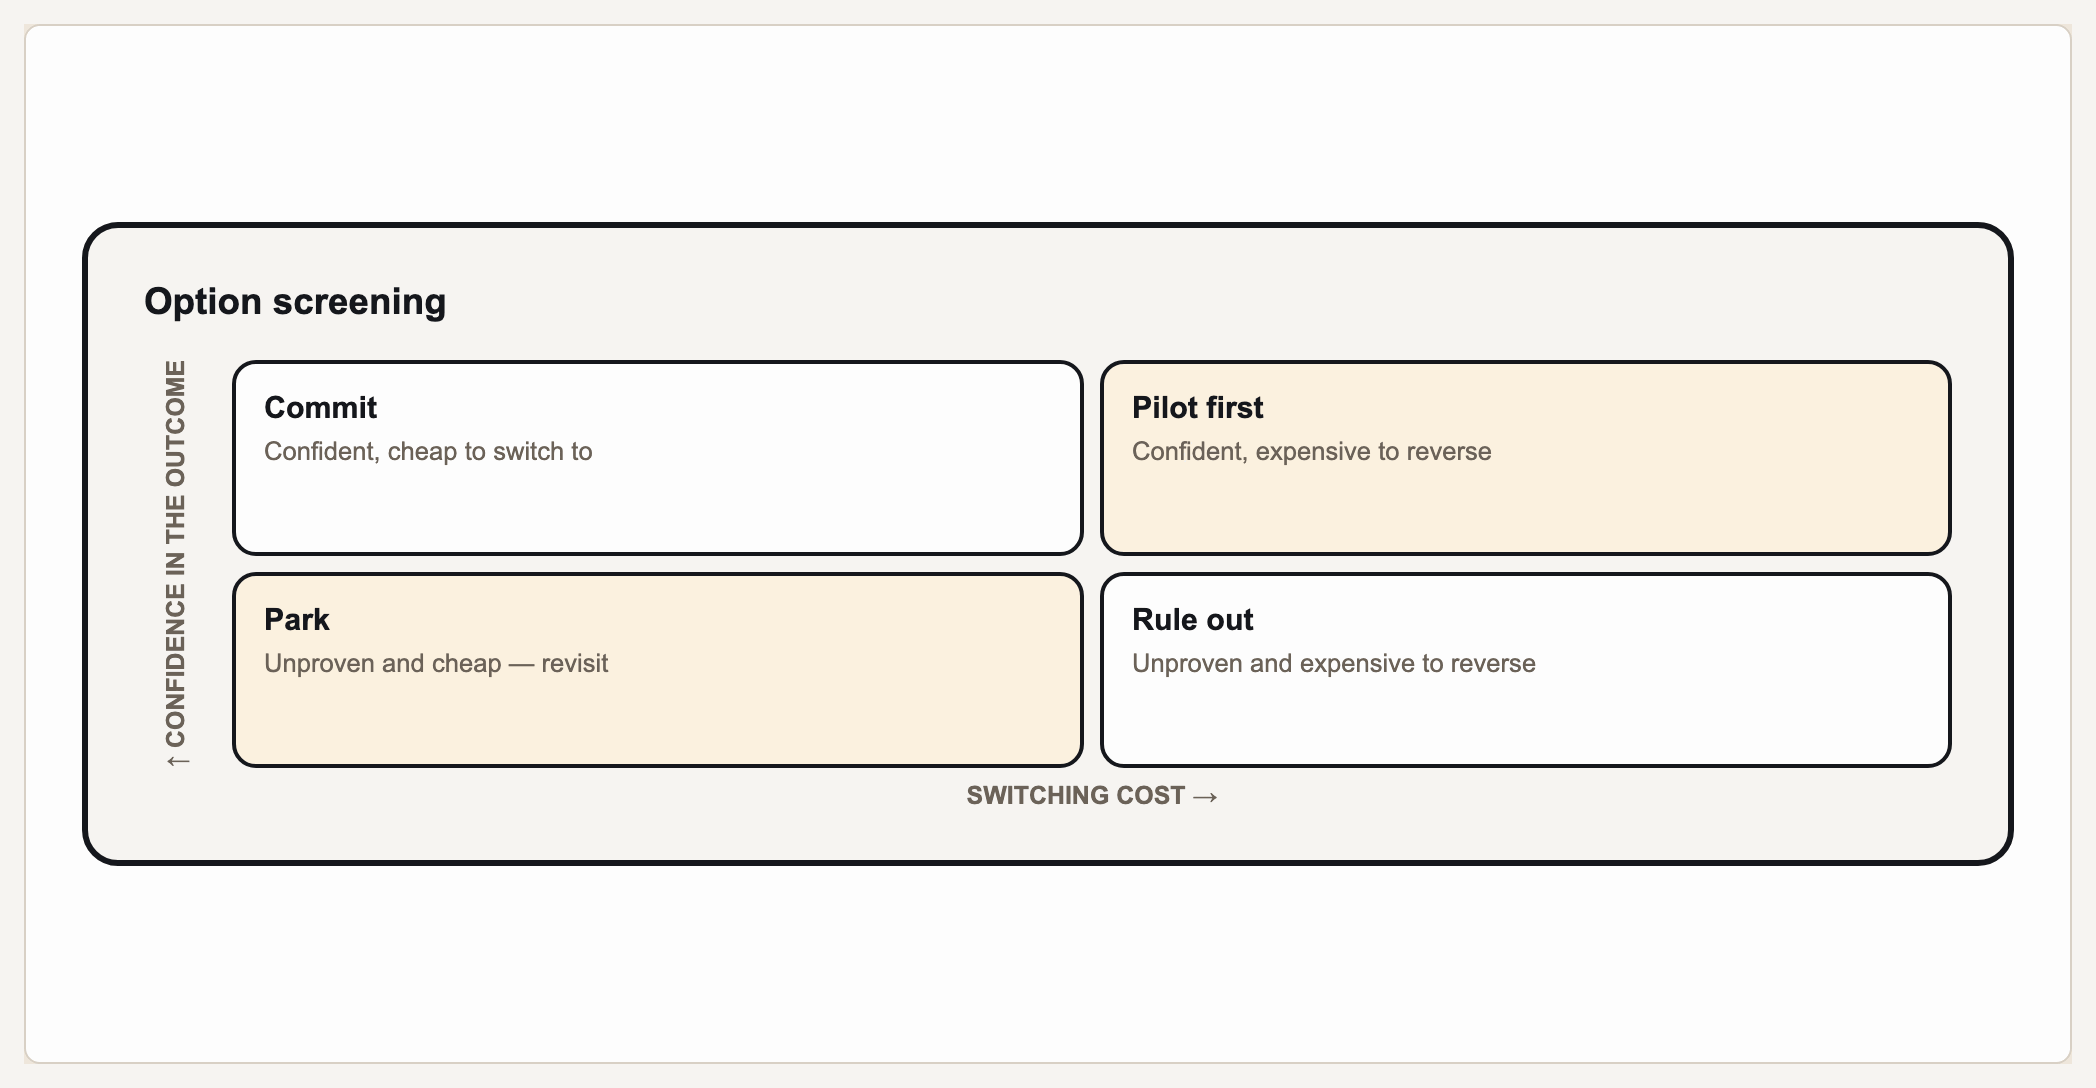
A weighted decision matrix (also called a weighted scorecard or Pugh matrix) is a table that ranks options against criteria that don't all matter equally. Each criterion gets a weight, you score every option against every criterion, and each option's total is the sum of its weighted scores — the highest total is the recommended choice. Gixo Prism's DecisionMatrix / WeightedScorecard actually computes those weighted totals and the ranking from the criteria, weights, and scores you enter — deterministically, with no AI image model in the loop — rather than handing you a blank grid to total up by hand.
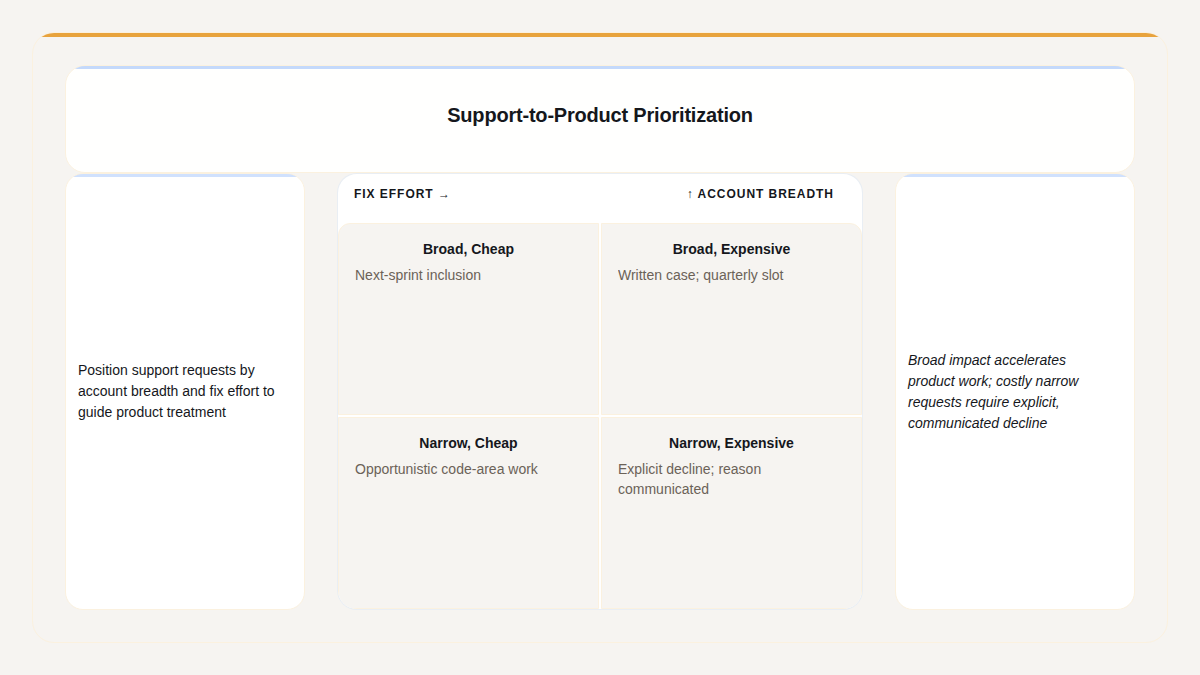
A real Gixo Prism decision matrix — options placed against the criteria you choose.
What makes a decision matrix generator actually useful?
A decision matrix is only as good as its arithmetic. If the tool just gives you a grid, you're still adding weighted scores by hand — and one transposed digit changes the winner.
This is the whole point. Enter your criteria, weights, and per-option scores in the scorecard maker, and it multiplies each score by its criterion weight, adds up each option's weighted scores, and gives you a total for every option — you don't do the arithmetic.
Once the totals are computed, the scorecard maker ranks the options and names the winner — or says so plainly when two options tie — so the recommended choice is obvious: a weighted scorecard, not just a formatted table.
No AI model scores this table and no model guesses the totals. The scorecard maker computes them on the server from your exact numbers, so the same scores and weights always give the same totals and the same ranking.
Give cost more pull than nice-to-haves, or vice versa. Change a weight and score again, and the totals and ranking are recomputed from the new numbers — so you can pressure-test how sensitive the decision is to each criterion.
Add an option, adjust a score, or reweight a criterion and score again for recomputed totals. Signed in, download the computed scorecard as a PDF report; a Gixo Prism decision page exports as HTML, and its owner can also export a PNG for a deck, document, or page.
Apply your brand palette and the scorecard stays consistent with every other chart and diagram you build in Prism — plus theme presets to start from.
A decision matrix example: choosing a CRM
Three options, four weighted criteria. The scorecard maker multiplies each score by its criterion weight, adds up each option's weighted scores, and ranks the options — here's the arithmetic it does for you.
| Criterion (weight) | Option A | Option B | Option C |
|---|---|---|---|
| Cost (weight 5) | 4 → 20 | 3 → 15 | 5 → 25 |
| Ease of use (weight 4) | 5 → 20 | 4 → 16 | 3 → 12 |
| Integrations (weight 3) | 3 → 9 | 5 → 15 | 3 → 9 |
| Support (weight 2) | 4 → 8 | 4 → 8 | 2 → 4 |
| Weighted total | 57 | 54 | 50 |
| Rank | 1st | 2nd | 3rd |
Scores of 1–5 times the criterion weight give the weighted cells, and each option's weighted cells add up to its total. Option A wins on 57 — even though Option C scores best on cost — because A's lead on ease of use (20 weighted points against 12) outweighs C's lead on cost (25 against 20). Change a weight or a score in the scorecard maker and score again: it recomputes the totals and re-ranks the options from the new numbers.
How do you build a weighted decision matrix with Gixo?
Five steps from a decision you're stuck on to a computed, ranked scorecard.
The candidates you're choosing between — vendors, roles, features, cities, whatever the decision is.
The dimensions that matter — cost, ease of use, risk, fit — one row per criterion.
Decide how much each criterion counts. Higher weight means that criterion pulls harder on the total.
Rate each option from 1 to 5 against each criterion. The scorecard maker multiplies each score by its criterion weight, adds up each option's weighted scores, and ranks the options for you.
Tweak weights or scores and score again to stress-test the result. Signed in, download the computed scorecard as a PDF report, or build the decision as a Gixo Prism decision page and export it for your deck or document.
Frequently Asked Questions
Explore the Prism visual toolkit
Updated