
BCG Matrix Maker
Use a growth-share framework to discuss your products or business units — market growth on one axis and relative market share on the other. Calculate and review those figures yourself, then choose each item's quadrant in the linked 2×2 maker: star, cash cow, question mark, or dog. Prism draws the labels and layout you supply; it does not calculate thresholds or assign quadrants from growth and share values.
The BCG matrix — also called the growth-share matrix or Boston matrix — is a 2x2 that plots a company's products or business units on two axes: market growth rate (vertical) and relative market share (horizontal). The four quadrants are stars (high growth, high share), cash cows (low growth, high share), question marks (high growth, low share), and dogs (low growth, low share). In Gixo Prism you review each product or business unit, calculate the figures, and assign its quadrant in the 2×2 maker: star, cash cow, question mark, or dog. Prism renders the labels and layout you choose deterministically without an AI image model choosing their positions, while the growth and share calculations remain yours.
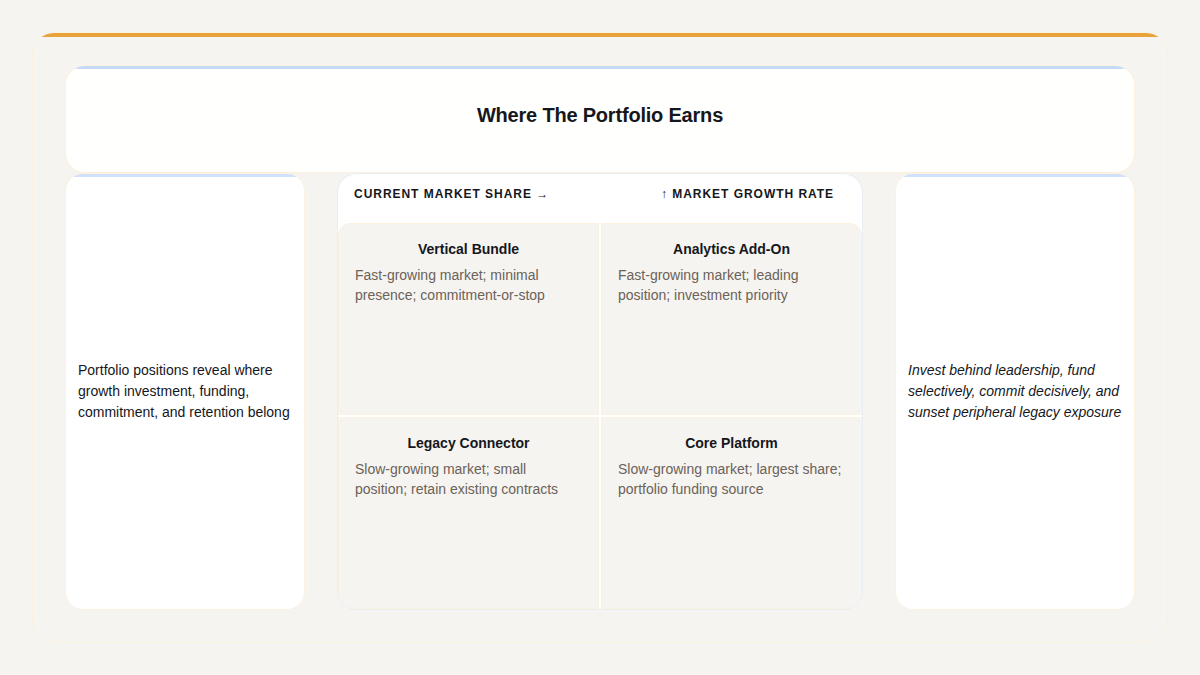
A real Gixo Prism matrix — your products placed against the two axes you name.
The four BCG categories, by market growth and share
Every product lands in one of four quadrants, defined by where it sits on market growth and relative market share.
Market leaders in fast-growing markets. They usually consume cash to hold position, but are the businesses most likely to become tomorrow's cash cows as growth slows.
Leaders in mature, slow-growing markets. They generate more cash than they need, funding stars and question marks elsewhere in the portfolio.
Small players in fast-growing markets. They need heavy investment to gain share and could become stars — or drain cash and slide into dogs.
Low-share products in slow-growing markets. They rarely generate much cash and are often candidates to hold, harvest, or divest.
Choose the quadrant for every item after reviewing your growth and share figures. Prism draws the matrix from those assignments and your axis labels; it does not calculate a product's quadrant from numerical market data.
Apply your brand palette to the matrix and it stays consistent with every other chart and diagram you build in Prism, plus theme presets to start from.
How do you make a BCG matrix with Gixo Prism?
Four steps from a portfolio spreadsheet to an exact, on-brand growth-share matrix.
For each product or unit, note its market growth rate and its relative market share (share vs. your largest competitor). You supply these figures.
Review each product's growth and share values yourself, decide whether it belongs in star, cash cow, question mark, or dog, then enter its quadrant tag and label in the maker.
Choose star, cash cow, question mark, or dog for each item, then supply its quadrant tag in the maker. Prism arranges the tagged items and labels in the grid; the growth and share calculations remain yours.
Pick a theme preset or your Brand Kit, then export the matrix as clean HTML/SVG for your strategy deck, board doc, or page.
Frequently Asked Questions
Explore the Prism visual toolkit
Updated