
AI Timeline Maker
List your dated events — a kickoff, a launch, a milestone, a moment in history — and Gixo Prism renders the supplied event sequence; arrange and review chronological order yourself. No dragging nodes onto a line, no eyeballing spacing. The event order you supply sets the sequence, and the labels you type are the labels that render, in the order you meant, every time.
A timeline is a visual that arranges events in chronological order along a line, so a sequence — a project plan, a product roadmap, a company history, a process rollout — reads at a glance. Gixo Prism has a supported timeline diagram geometry built for exactly this: you supply a concise set of dated events (a date or period plus a short label and optional detail), and Prism places them in order along a horizontal or vertical line, deterministically, with no AI image model in the loop. It's a generation tool you review and edit — but what you type is what renders, in the sequence you supplied and reviewed.
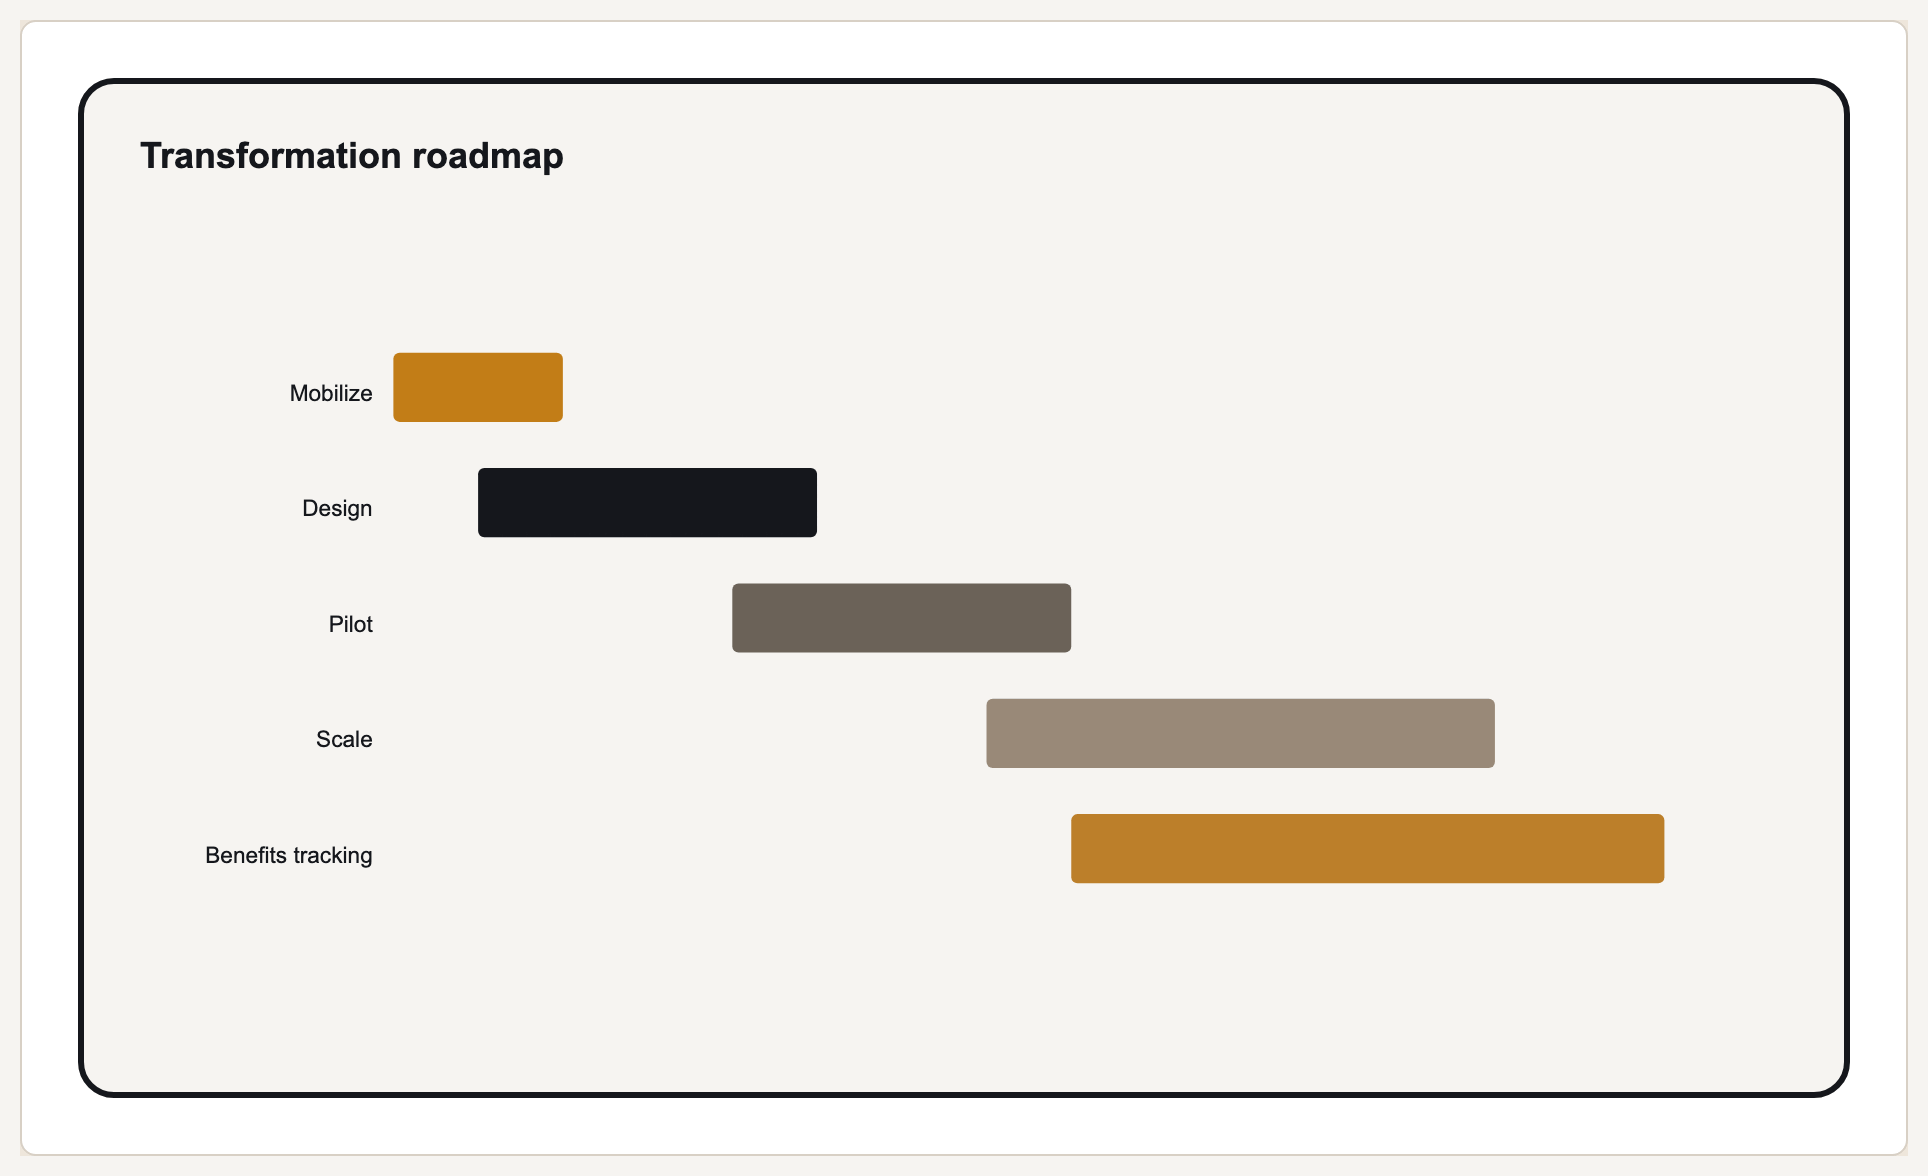
This historical transformation roadmap example is a Gantt chart. The timeline maker separately renders supplied dated events in their reviewed order.
What makes a timeline maker actually usable?
A timeline is a simple shape on paper — but every date, label, and gap between events has to land in the right order, or the story it tells goes wrong.
Enter your dated events and Prism places them along the line in the order you supplied; review the date labels and sort the events first. No dragging nodes, no eyeballing spacing — the timeline reflects your data, not an approximation of it.
Roadmaps, launch plans, onboarding steps, company milestones, or a historical sequence — the Timeline layout doesn't assume a use case. It just needs dated events with short labels.
No AI image model draws this. Prism renders the Timeline layout deterministically, so date labels and event order come from your supplied fields; review chronology, text fit and equal layout spacing.
Choose the orientation that fits your space — a vertical timeline for a doc or a tall slide, a horizontal one for a wide deck. Same events, same order, laid out to fit.
Apply your brand palette to the timeline and it stays consistent with every other chart, diagram, and infographic you build in Prism — plus theme presets to start from.
Add an event, fix a date, or swap a label, and the timeline re-renders exactly in the new order. Export as clean, self-contained HTML/SVG to drop into a deck, doc, or page.
How do you make a timeline with Gixo Prism? How to create a timeline in four steps
Four steps from a list of dates to an exact, on-brand timeline.
Enter your events, each with a date or period and a short label — a kickoff, a launch, a milestone, or a moment in history.
Choose the orientation that fits your slide, doc, or page — the same events, laid out to suit the space.
The Timeline layout places your events in the supplied order; you review and arrange the chronology — no dragging nodes onto a line, no eyeballing the spacing.
Pick a theme preset or your Brand Kit, then export the timeline as clean HTML/SVG for your deck, doc, or page.
Timeline infographic ideas and examples
A timeline works anywhere a sequence matters. A few starting points, each just a concise set of dated events:
- Project timeline — kickoff, discovery, build, beta, launch. The go-to for a plan review or a status update, where the order and the gaps between phases carry the message.
- Product roadmap — this quarter's release, next quarter's beta, the H2 milestone. Fewer, clearer dates read better than a dense timeline when you're setting direction.
- Company or brand history — founding, first customer, funding, expansion. An about page or an investor deck slide that shows momentum at a glance.
- Historical timeline — key dates in an era, a movement, or a discovery, for a lesson, a report, or an explainer.
- Onboarding or process rollout — day 1, week 1, day 30, day 90. A sequence people can follow without reading a wall of text.
The rule of thumb: keep it to 3–6 events with short labels. A timeline earns its place by making a sequence obvious — too many nodes and it becomes the thing you were trying to avoid. If a step depends on other steps or branches, a process or tree diagram may fit better; for a pure chronological sequence, the timeline is the shape.
Frequently Asked Questions
Explore the Prism visual toolkit
Updated