
Gantt Chart Maker
Give it tasks, durations and what depends on what. It calculates the working-day dates, validates the dependencies and draws the critical path — rather than asking you to position bars by eye.
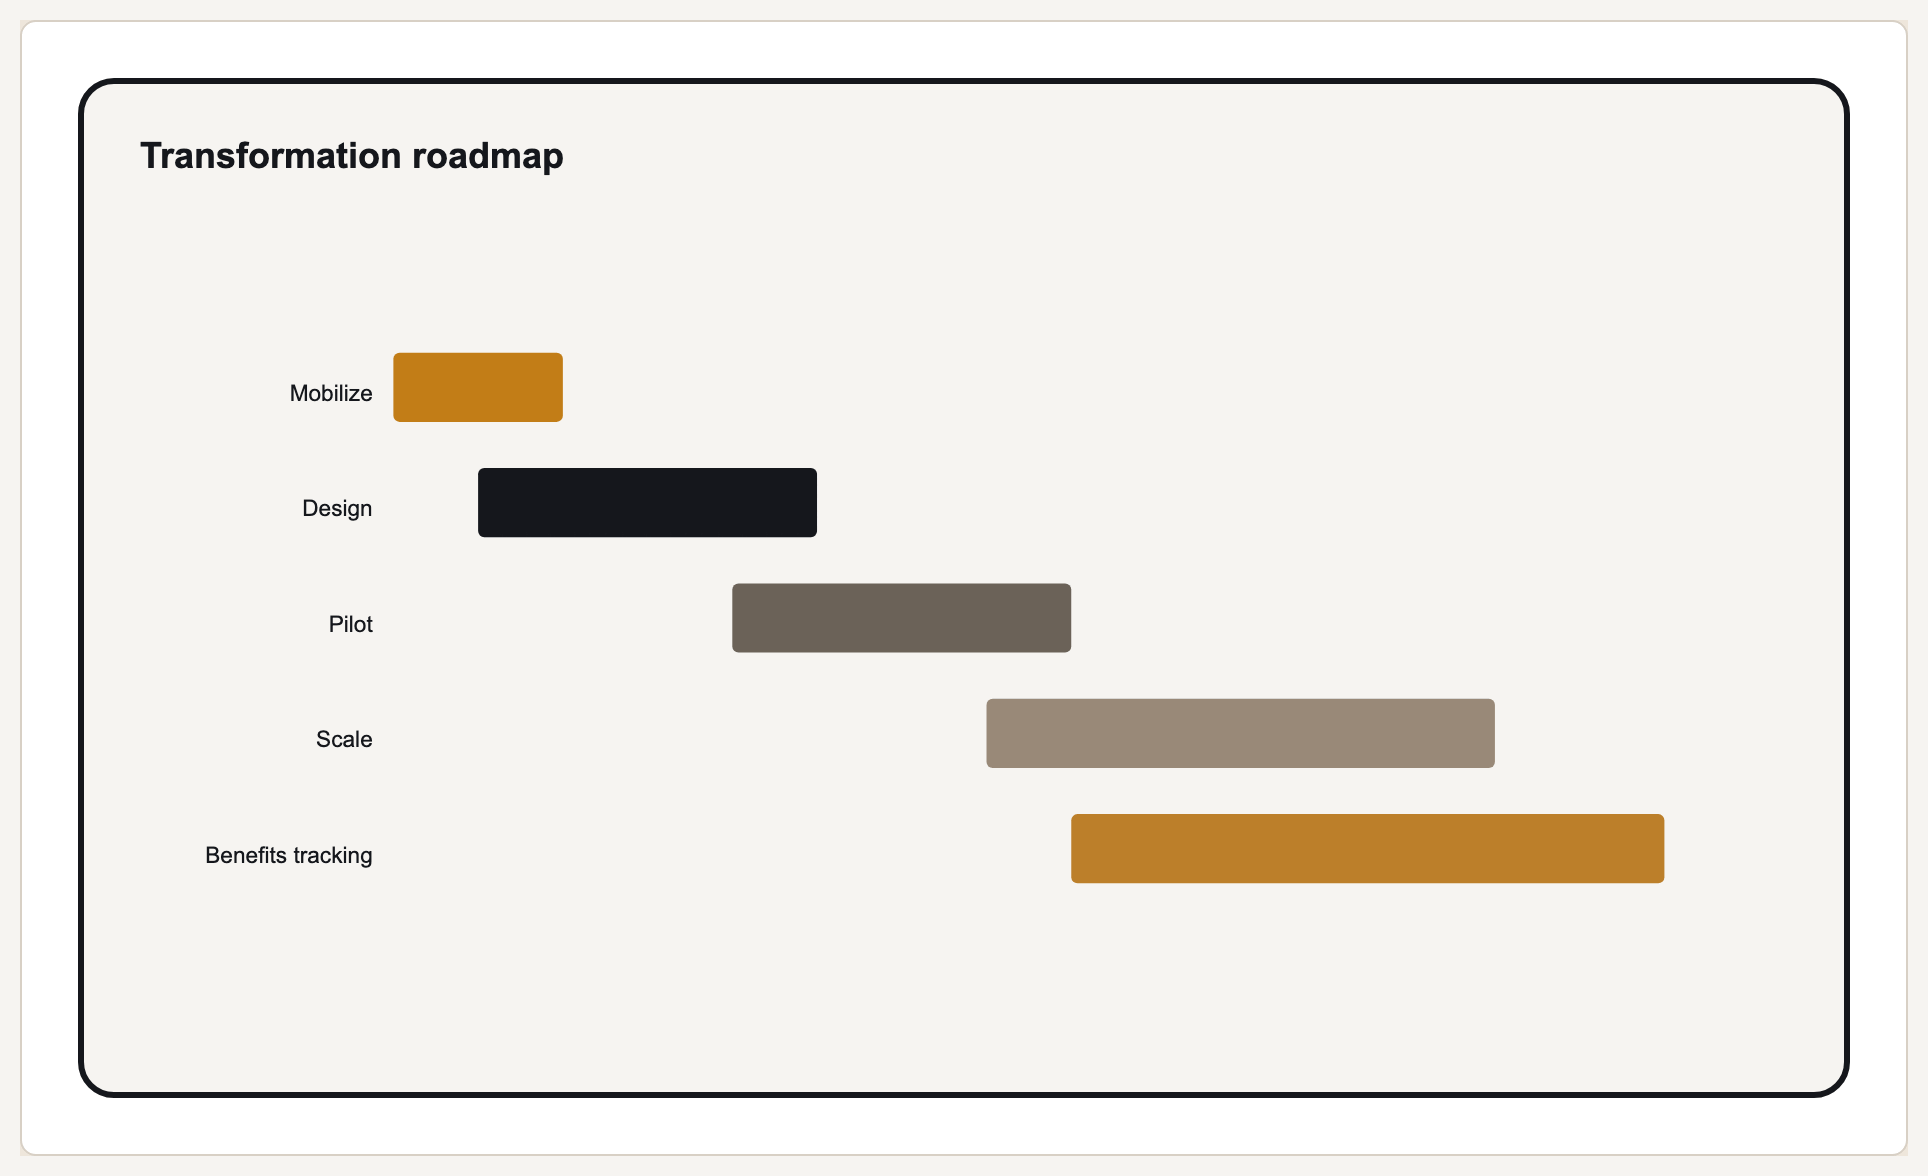
A Gantt chart is a horizontal bar chart of a schedule: each task is a bar running from its start date to its finish date, stacked in rows down the page, with the dependencies between them drawn as links. It answers two questions a task list cannot — what has to finish before this can start, and what happens to the end date if this task slips. Named after Henry Gantt, who popularised the form around 1910, it remains the standard way to show a project plan to people who are not managing it day to day.
Where most Gantt charts go wrong
Not in the drawing — in the arithmetic behind it. A chart made by dragging bars around encodes whatever the person dragging believed at the time, and nothing recalculates when that turns out to be wrong.
A ten-day task starting Thursday does not finish a week on Saturday. Prism counts working days and skips the holidays you declare, so the finish date is the one your team will actually hit.
Arrows drawn between bars usually mean nothing to the drawing tool. Here a predecessor is a constraint: it is validated, and a circular or impossible dependency is reported rather than rendered.
Without float, every task looks equally urgent. Prism computes CPM float and marks the critical path, so you can see which slips move the end date and which absorb quietly.
What is a Gantt chart? A worked example, element by element
| Element | What it shows | Why it matters |
|---|---|---|
| Bar length | Task duration in working days | The estimate you are actually committing to, once weekends and holidays are removed |
| Dependency link | This task cannot start until that one finishes | Turns a wish-list of dates into a schedule that recalculates when something moves |
| Float (slack) | How long a task can slip without moving the end date | Tells you where to spend attention; zero float means the deadline moves with it |
| Critical path | The chain of zero-float tasks | The only sequence where saving a day saves a day on the project |
| Milestone | A zero-duration checkpoint | Marks a decision, gate or hand-off that others are planning around |
| Progress | How much of a bar is complete | Separates "started" from "on track", which a bar alone cannot show |
How to make a Gantt chart with Prism
Task name and how many working days it takes. Durations, not dates — the dates are derived.
Say which task must finish first. This is the part that makes it a schedule rather than a picture of one.
Declare the project start and any holidays. Working-day arithmetic handles the rest.
Prism draws the bars, links, milestones and critical path, and exports the schedule with computed float alongside the graphic.
Gantt chart template, Gantt chart in Excel, or a schedule engine?
A Gantt chart template is the right tool when the plan is small and stable — six tasks, one owner, no real dependency chain. You fill in bars, it looks like a plan, and nothing needs to recalculate because nothing is going to move.
A Gantt chart in Excel is the usual next step, built from a stacked bar chart with a transparent first series. It works, and it is genuinely useful when the numbers already live in a spreadsheet. What it does not give you is dependency validation or critical-path analysis: the bars are positioned by the dates in your cells, so if a date is wrong the chart is confidently wrong with it. Prism exports an editable XLSX schedule on a paid plan, so the spreadsheet stays available — it just is not where the arithmetic happens.
Prism is the third option: you describe the work and the constraints, and the schedule is computed. That matters once a plan has enough dependencies that you cannot hold the consequences of a slip in your head — which is usually sooner than people expect.
Frequently Asked Questions
Explore the Prism toolkit
Updated