
Venngage Alternative
Use Prism when the job is explicit data mappings and reviewed source revisions. Venngage offers infographic drafts from prompts and source files, including spreadsheet data, plus conversational chart editing. Compare the same source material, the changes you need to make and the editable file your colleague needs. Prism rendering does not independently verify the source. Related workflow: Venngage official workflow
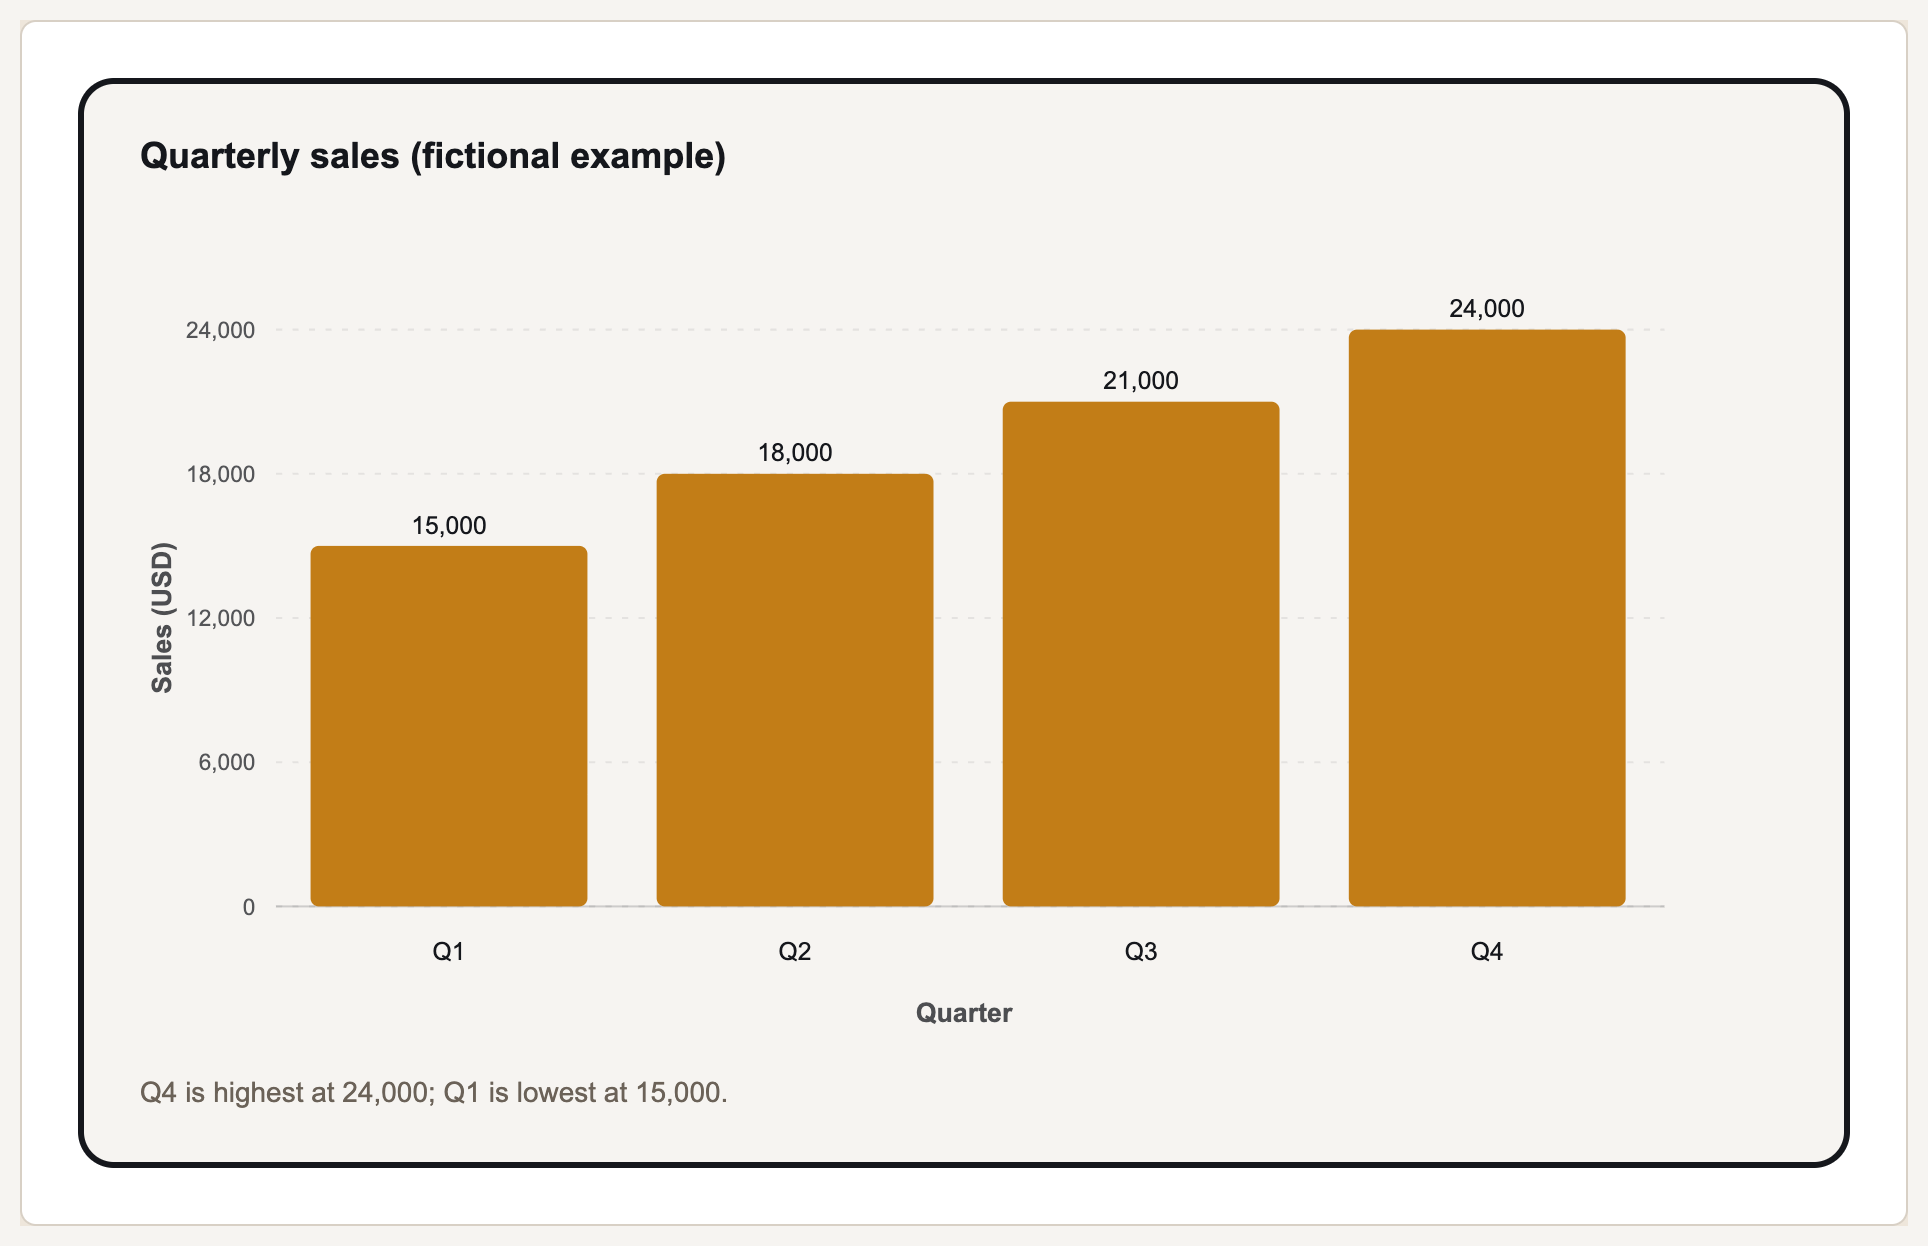
Prepared input
Quarter,Sales USD
Q1,15000
Q2,18000
Q3,21000
Q4,24000
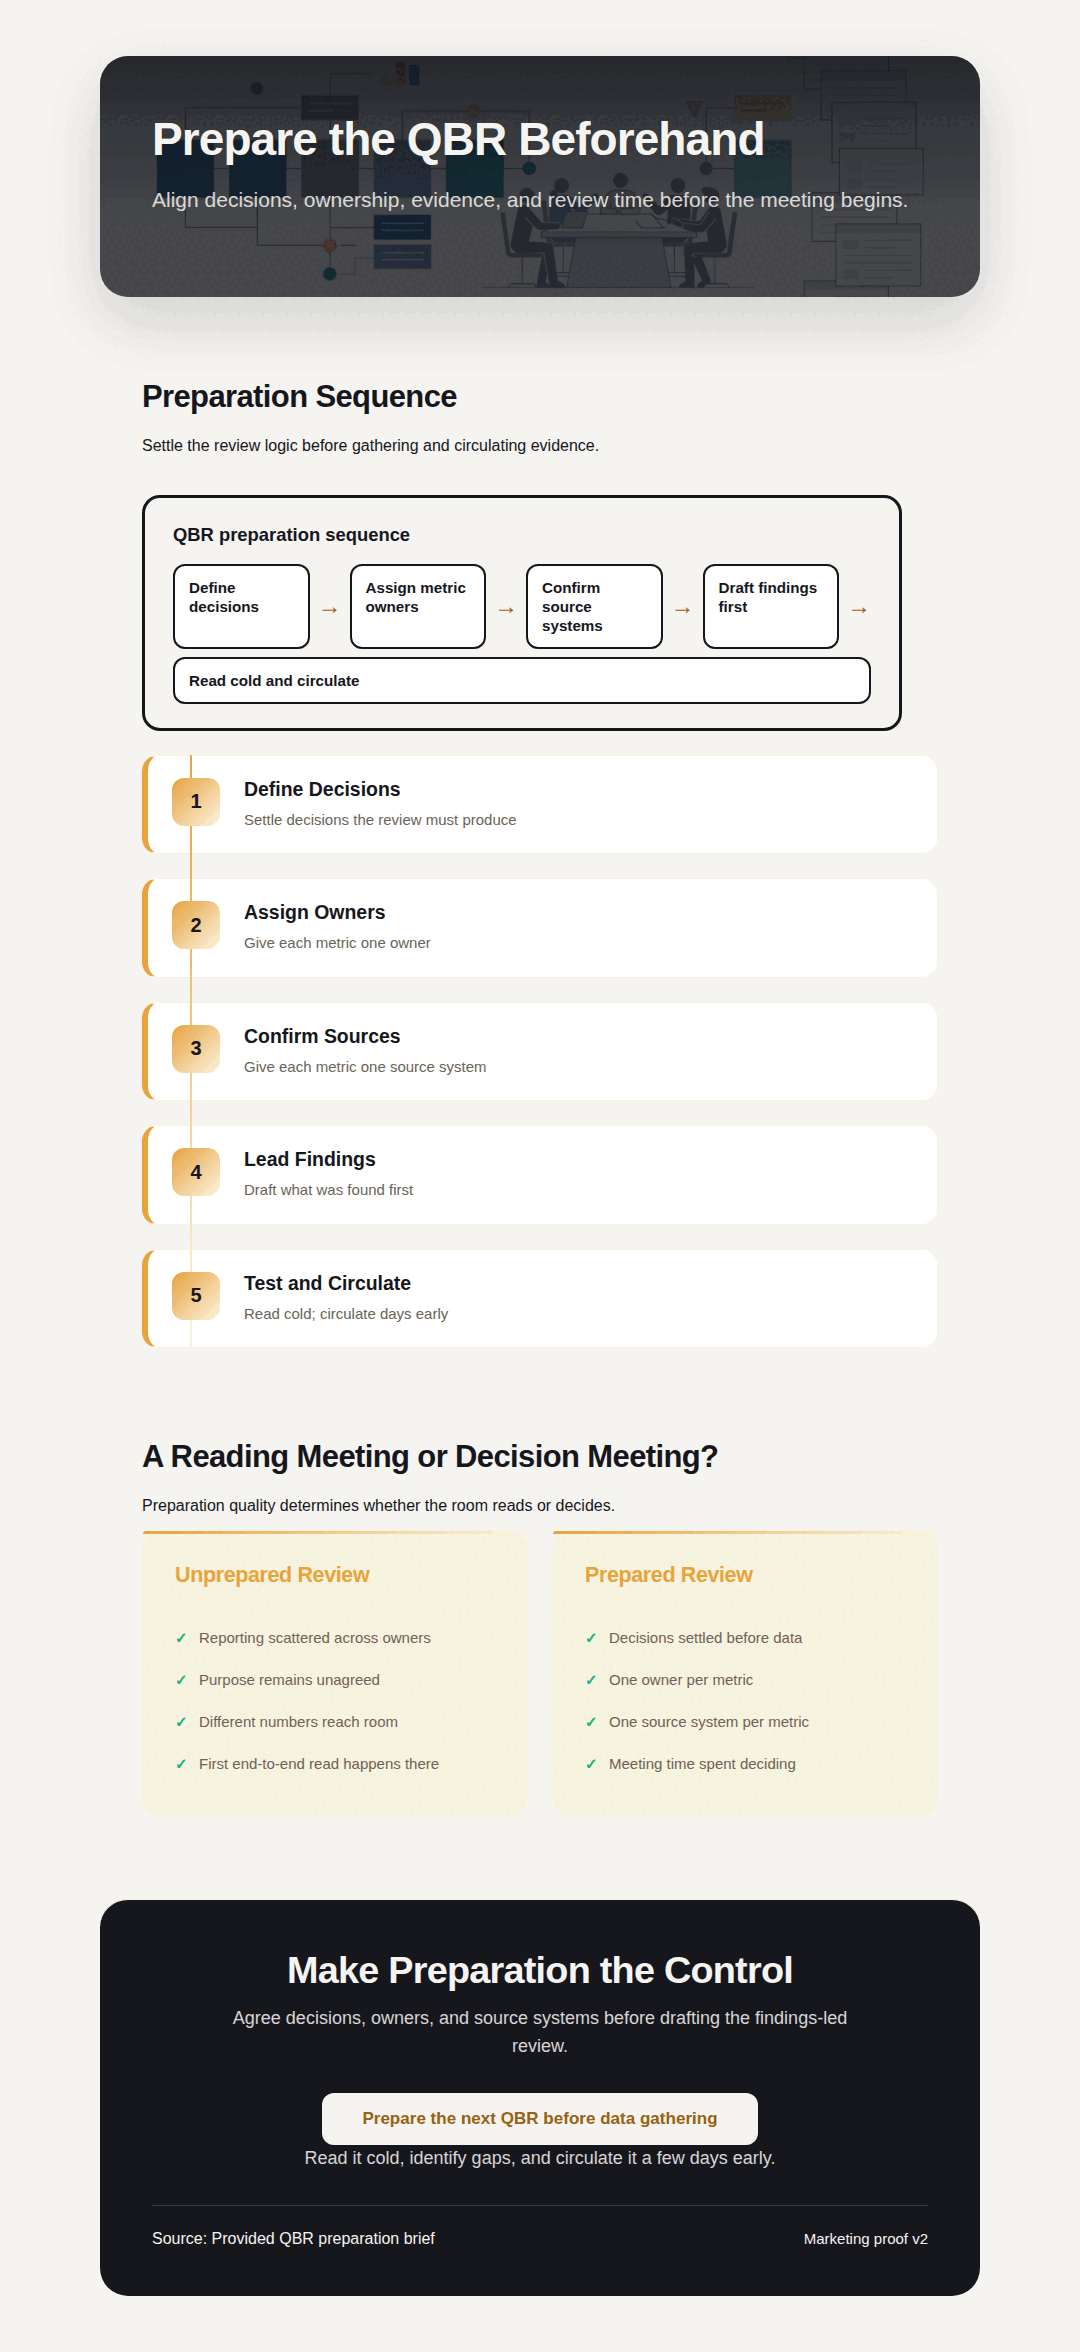
Why teams pick Prism as a Venngage alternative
Venngage offers infographic drafts from prompts and source files, including spreadsheet data, plus conversational chart editing. For explicit data mappings and reviewed source revisions in Prism, review the accepted data and structure, preserve the source context and inspect the result. You can use both tools when their respective outputs fit the project.
Prism's chart, diagram, flowchart, and card makers are deterministic — no AI in the loop. The figure you enter is the figure that renders, every time, never a garbled image.
Paste your numbers and get a clean SVG chart in any of 22 types, from bar, line and pie to waterfall, Gantt and heatmap, handling the selected chart limits, with expanded data available.
Describe a process or paste steps and get one of 14 layouts — including process, cycle, pyramid, funnel, tree, pillars, matrix, Venn, concentric, stack, or graph.
Prism applies the selected maker styling or an eligible saved Brand Kit; inspect AI image styling separately, so a whole batch of visuals stays consistent without manual styling.
Start from a topic or a draft and Prism shapes it into a structured, content-backed infographic you can edit and export as PNG or HTML.
$10/month gets you every maker, infographics, and the Campaign kit — the core makers are available from Starter; eligible Brand Kit, seats and organization features vary by plan.
Map a decision flow or a swimlane and Prism lays it out cleanly, with exact labels and consistent spacing throughout.
Change the data, labels, and layout and the makers re-render exactly. Export infographics as PNG or HTML; export maker visuals as clean HTML, SVG, PNG, PDF, or PPTX.
Turn a single stat, quote, callout, definition, or comparison into a sharp, on-brand card you can drop into a deck, doc, or post.
Prism vs Venngage on price
From there, Gixo Prism starts at $10/month for Starter (one seat) and rises through Professional, Business and Enterprise; the Brand Kit, which applies your own colours and typeface, starts on the Professional plan. Compare current vendor billing term, seat rules and feature limits on the official pricing page. Venngage offers AI infographic drafts from prompts and source files, including spreadsheet data, plus conversational chart editing. Compare the reviewed data and export workflow with Prism rather than assuming manual-only entry. Venngage official workflow (checked 11 October 2026).
- Gixo Prism — from $10/month, with the Brand Kit from the Professional plan. Every maker, AI infographics, and the Campaign kit are in the product from the entry plan. A 14-day free trial needs no credit card
- Venngage and Prism offer different plan configurations. Compare the current billing term, included seats, required brand controls and the actual export workflow. Prism public previews and attributed HTML/SVG are free; clean exports of an unsaved preview need eligible access, while saved-owner downloads follow a separate rule.
- Venngage offers AI infographic drafts from prompts and source files, including spreadsheet data, plus conversational chart editing. Compare the reviewed data and export workflow with Prism rather than assuming manual-only entry.
- What Prism does not charge for: there is no per-seat jump to keep your team in sync, and no separate add-on to unlock charts versus diagrams versus infographics. The entry plan covers the core toolkit; eligible brand and organization features have their separate plan conditions.
| Plan | Entry price (monthly) | Free tier | What's included |
|---|---|---|---|
| Gixo Prism | From $10/mo | 14-day trial, no card | Every maker + infographics + packs |
| Venngage Premium | Check current official plan and billing term | Check current official plan and billing term | Editor + templates |
| Venngage Business | Check current official plan and billing term | Check current official plan and billing term | Brand kits + collaboration |
| Visme Starter | Check current official plan and billing term | Check current official plan and export terms | Editor + templates |
Where Venngage still wins
An honest comparison cuts both ways. Venngage is a mature, well-built product, and these are real reasons to use it.
- Template breadth. If you want to start from a finished-looking design and adapt it, ask Venngage which of its current templates fit your format. A large template library is something Prism does not try to match.
- Accessibility and WCAG tooling. If public-sector or compliance work needs WCAG checks, ask Venngage what its accessibility workflow covers today. Prism enforces readable, contrast-checked output on its own visuals, but has no dedicated accessibility workflow of that kind.
- Venngage offers infographic drafts from prompts and source files, including spreadsheet data, plus conversational chart editing. Prism offers selected maker inputs, supported object edits and recorded revisions. Decide from the required source update, notation and handoff format; this page has no measured speed, accuracy or design-quality benchmark.
- Use both. Plenty of teams keep Venngage for polished, template-driven layouts and accessible reports, and reach for Prism whenever the figures must be exact and consistent on-brand across a set. They solve different halves of the job.
Switching from Venngage to Prism
From your data to a finished, on-brand visual in a few steps.
Open Prism and start the 14-day free trial — no credit card.
Start from a subject, paste a draft, or drop in the numbers you want to show.
Choose an infographic, chart, diagram, flowchart, or card. The chart, diagram, flowchart and card makers keep your accepted values exact. Review the text, numbers and imagery of an AI infographic before you use it. Prism applies your brand palette across the set.
Export the infographic as PNG or HTML, or take a maker visual as clean HTML, SVG, PNG, PDF, or PPTX into your deck, doc, or page.
Prism vs Venngage: two infographic makers at a glance
What each tool is actually built to do well.
- Venngage offers infographic drafts from prompts and source files, including spreadsheet data, plus conversational chart editing. For explicit data mappings and reviewed source revisions in Prism, review the accepted data and structure, preserve the source context and inspect the result. You can use both tools when their respective outputs fit the project.
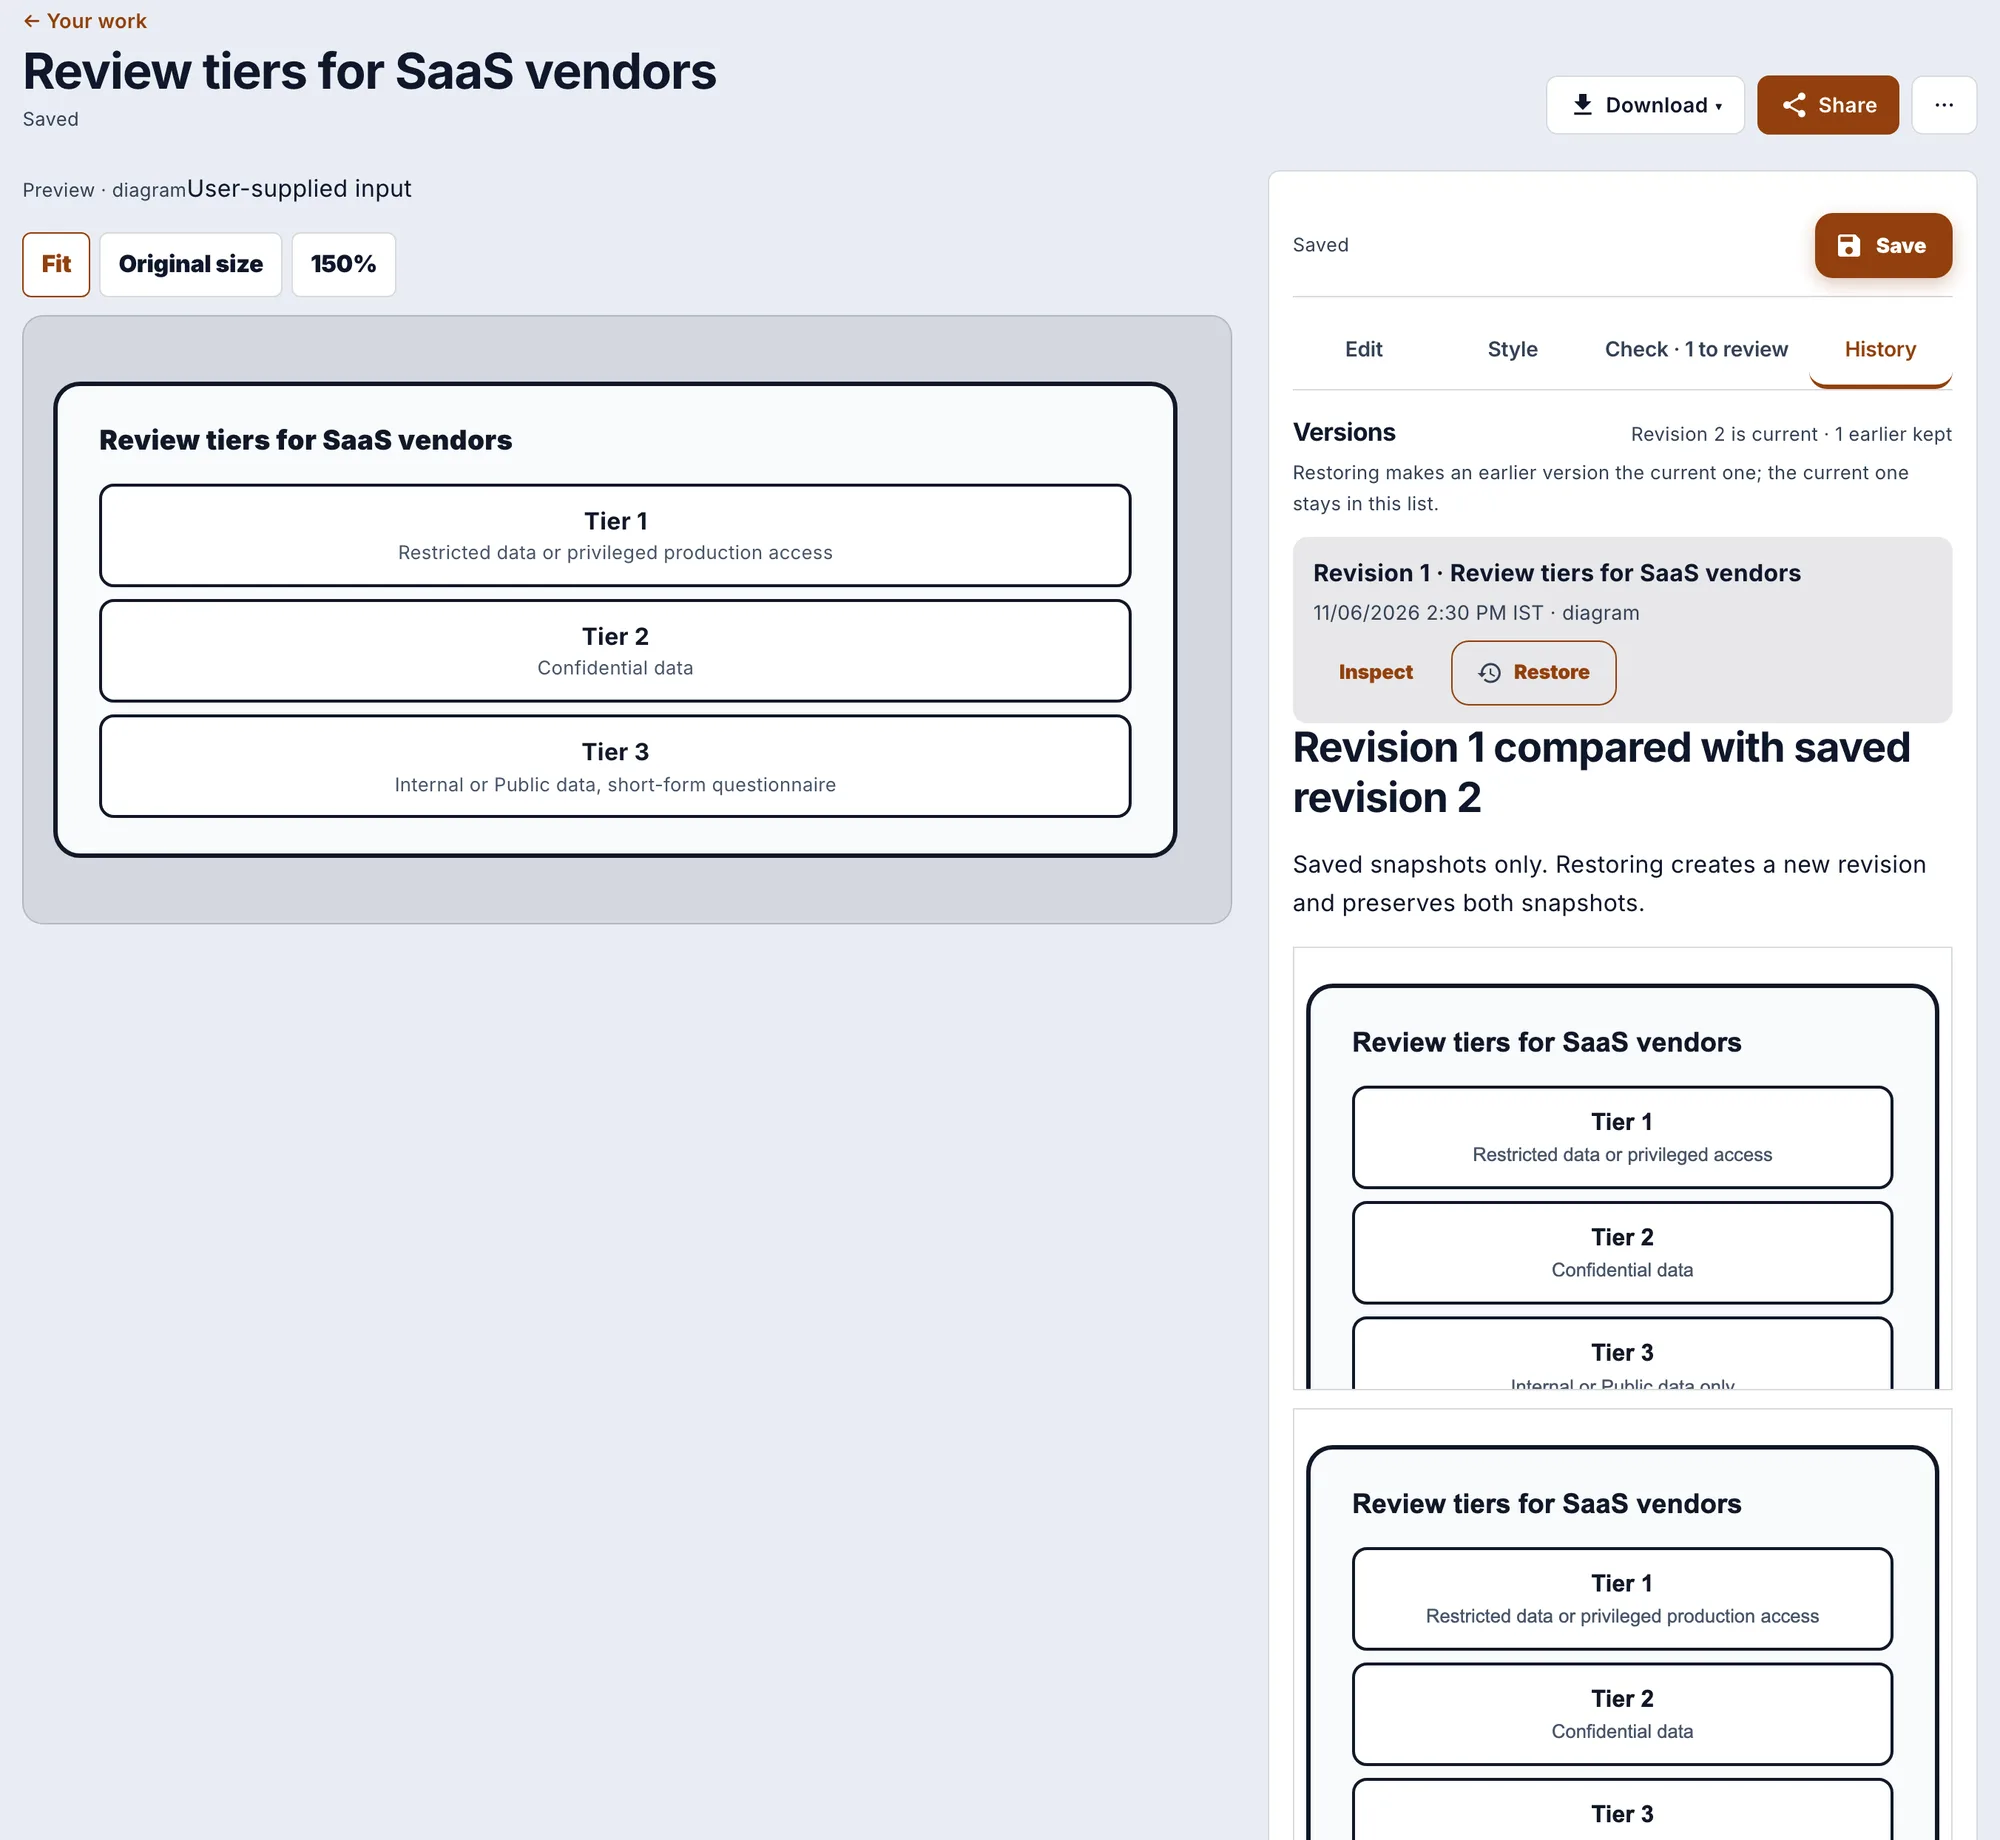
- Venngage offers infographic drafts from prompts and source files, including spreadsheet data, plus conversational chart editing. Prism starts from accepted maker inputs or a separately reviewed AI proposal, and supported saved visuals have bounded object controls. Compare source mapping, notation, review permissions and editable exports rather than assuming one tool is manual-only or inherently correct.
- Venngage offers infographic drafts from prompts and source files, including spreadsheet data, plus conversational chart editing. For explicit data mappings and reviewed source revisions in Prism, review the accepted data and structure, preserve the source context and inspect the result. You can use both tools when their respective outputs fit the project.
- Export: Prism exports infographics as PNG and HTML, and maker visuals as clean HTML, SVG, PNG, PDF, or PPTX — a chart exported to PPTX arrives as editable PowerPoint content rather than a flattened image. In the PPTX, bar, horizontal bar, stacked bar, line, area, pie, donut, scatter, radar, and bar-and-line combo charts arrive as native PowerPoint charts with their numbers in an embedded workbook that Edit Data opens; waterfall, funnel, Gantt, heatmap, treemap, symbol map, Marimekko, bubble, Sankey, bullet, slope, and dumbbell charts arrive as editable PowerPoint shapes and text, as does any chart PowerPoint cannot draw the way Prism does, such as a pie with a negative slice or an area chart with a missing value. Ask Venngage which file formats and downloads your plan includes.
- Venngage offers infographic drafts from prompts and source files, including spreadsheet data, plus conversational chart editing. For explicit data mappings and reviewed source revisions in Prism, review the accepted data and structure, preserve the source context and inspect the result. You can use both tools when their respective outputs fit the project.
Frequently Asked Questions
Explore the Prism visual toolkit
A Venngage alternative where the data is right
Start from a topic or your own numbers, and get an editable, on-brand infographic you can trust — from $10/month, with the Brand Kit from the Professional plan. Supported retained fields and recomposition stay editable, generated-image geometry stays locked, and every AI label, number and visual detail needs your review before you use it.
Updated