
Heatmap Chart Maker
Paste a grid of values and get an exact heat map — every cell shaded to the number you entered, never to an approximation.
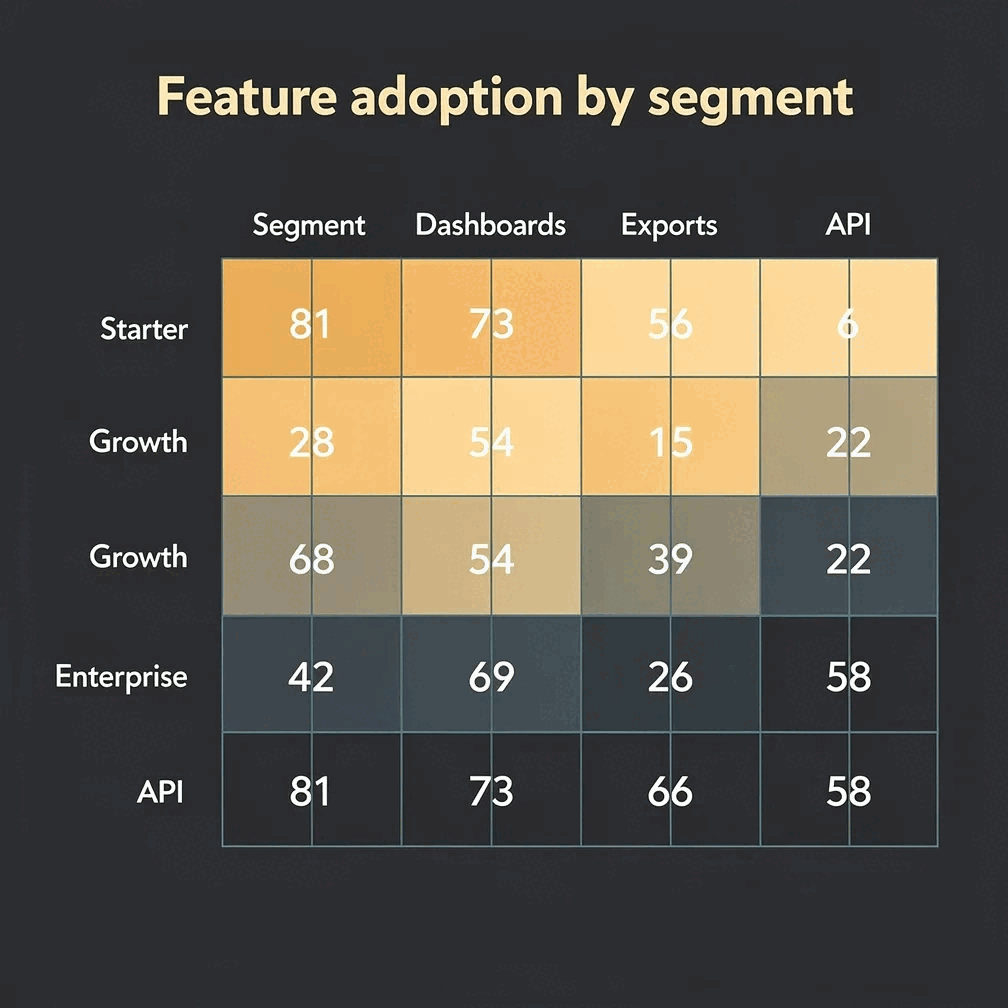
A heatmap, also written heat map, is a grid where colour encodes magnitude: rows and columns give you the two dimensions, and the shade of each cell gives you the value. It is the right chart when you have a measure across two categories — sales by region and month, errors by service and day, scores by team and criterion — and a bar chart would need dozens of bars to say the same thing. Note that a data heatmap is a different thing from a website heatmap: this page is about charting values you supply, not about tracking where visitors click.
What makes a heatmap chart maker trustworthy?
The shade of a cell is computed from the number you entered. Nothing is smoothed, rounded to a nicer band, or adjusted to make the grid look tidier.
A heat map a reader has to decode against a colour ramp is half a chart. Prism prints the value inside every cell, so nobody has to convert a shade back into a number.
The heatmap is rendered deterministically to SVG from your grid, not generated as a picture of a heatmap. That is why the numbers survive.
Heat map or bar chart: when to use which
Use a bar chart when you have one dimension and want precise comparison — the eye reads length far more accurately than colour. Use a heat map when you have two dimensions and want the pattern: which row runs hot, which column is empty, where the outlier sits. If your reader needs to quote exact figures, keep the values printed in the cells rather than relying on shade alone.
How do you make a heatmap with Gixo Prism?
Paste rows and columns with a value at each intersection, or upload the CSV you already have.
Pick the colour range and whether it runs from zero or from the minimum value. This changes what the chart says, so it is a decision rather than a default.
Read the grid back against your source, then export as SVG for a deck, a doc or a page.
A heat map is one of sixteen chart types Prism renders. See the full set on the chart maker overview.
Frequently Asked Questions
Explore the Prism chart toolkit
Updated