
Diagram Maker
Type your steps, pick a shape, and get a clean diagram with thick-ink, on-brand styling — labels rendered deterministically, without AI rewrites. Compact geometries shorten long labels to fit.
About this maker and export access
The Gixo Prism Diagram Maker turns a numbered list of steps into a finished diagram in one render, with no sign-up and no AI model in the loop. Pick one of 14 shapes — process, cycle, pyramid, funnel, tree, pillars, 2×2 matrix, Venn, concentric rings, or layered stack, or an explicit node graph — type or paste your labels, and the layout, spacing, arrows, and colours are computed by deterministic code, so the same input always produces the same diagram and your labels are never invented or paraphrased. To fit compact geometry, Venn and concentric labels are shortened at 16 and 18 characters; graph node labels, details, and connection labels are shortened at 19–30 characters depending on the field and whether an asset icon is present. One render accepts up to 200 steps and picks from 4 theme presets or your Brand Kit palette. Rendering and previewing are free and anonymous; downloading an HTML and SVG copy is free too and carries a visible Gixo Prism attribution; copying clean HTML without attribution and downloading PNG, PDF, and PPTX files require an active Prism trial or plan; an attributed embed copy is free. A visual you have saved to your account downloads in every format, with or without a plan.
Why teams use Prism
More
Start from an example
Brand colors
Applies to this visual and its exports. Your saved Brand Kit stays unchanged.
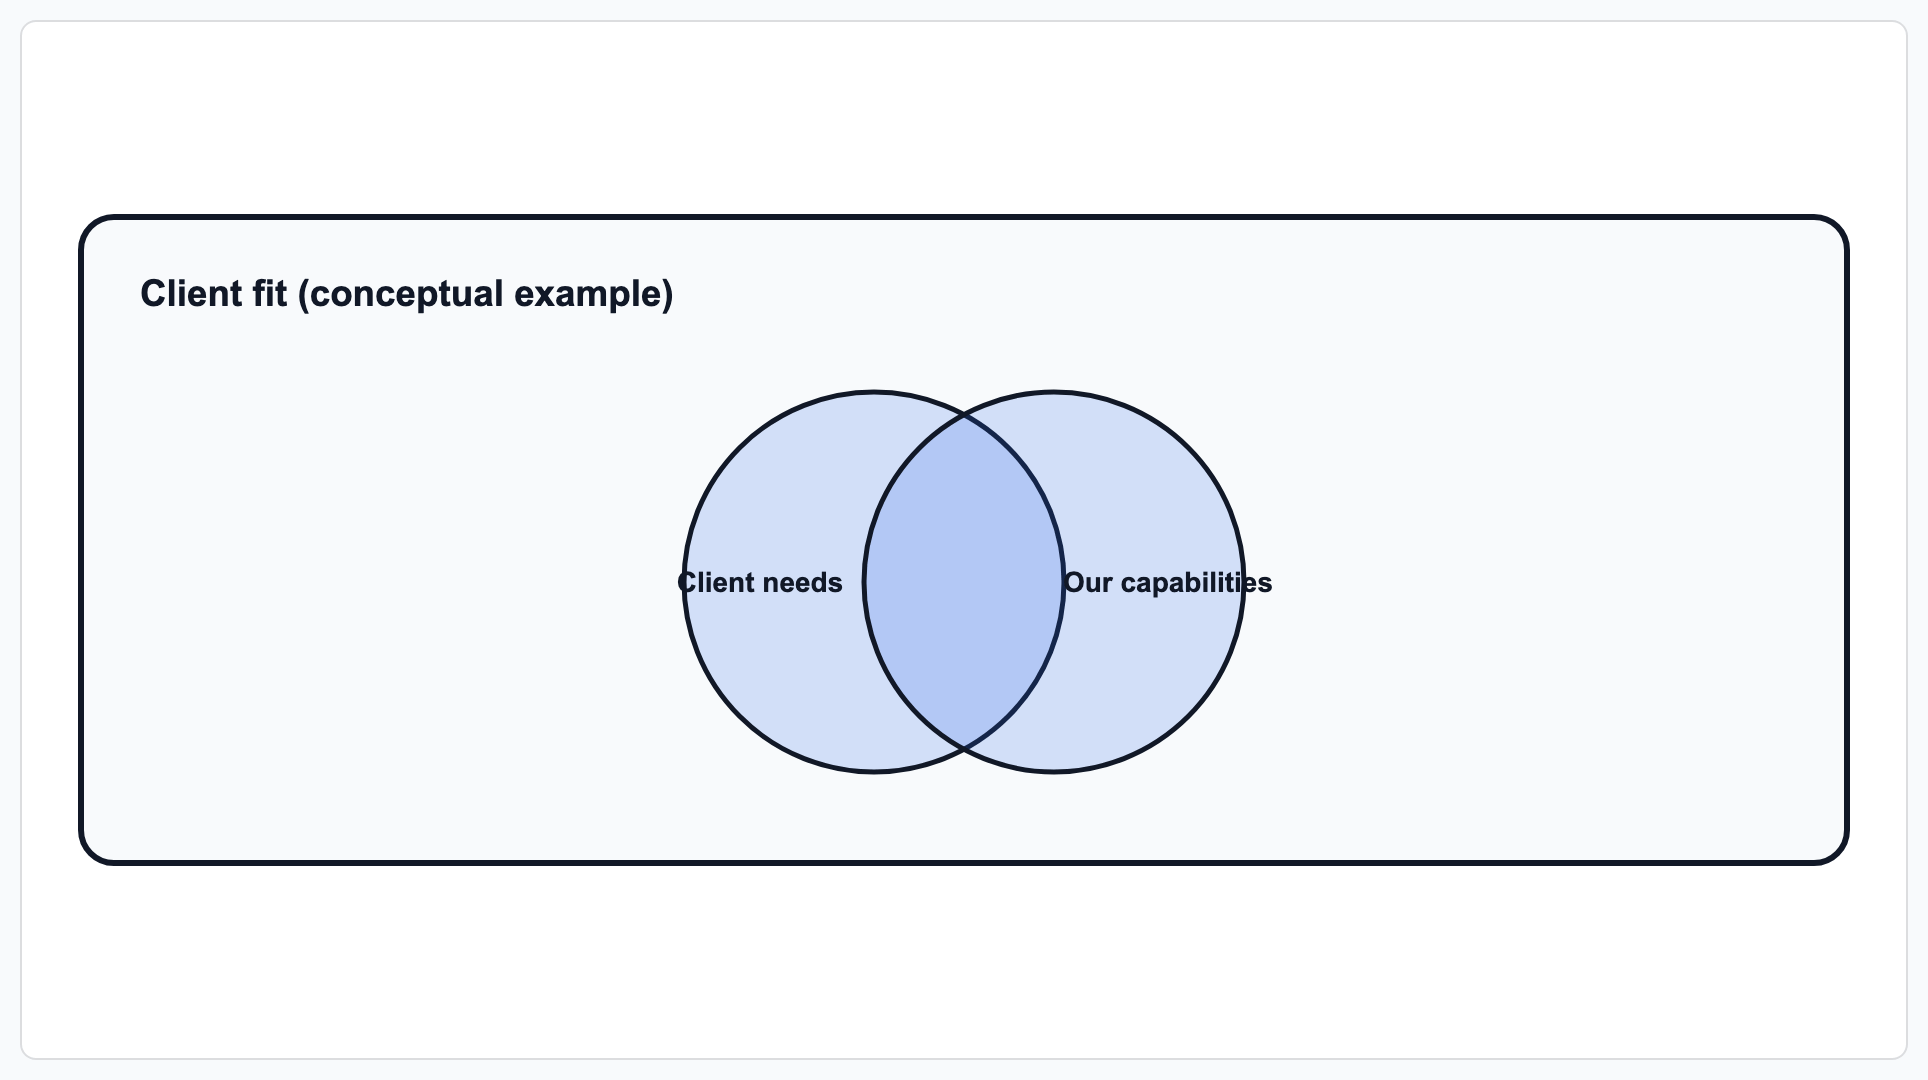
Edit your data on the left to update the live preview, or click Make diagram for full export and editing options.
What a diagram tool has to do
A diagram tool has one job: take a structure you are already holding in your head — an order, a hierarchy, an overlap, a ranking — and draw it so someone else sees it in a second. Three things separate the ones worth opening.
- The geometry has to follow the meaning. Steps that come back round are a cycle, not a left-to-right process. A ranking is a pyramid or a funnel depending on which end is wide. A blank canvas leaves that decision to you; the maker offers 14 shapes, and the table below maps examples to the meaning they carry, so the choice is made before you start typing.
- It has to draw what you typed. A tool that quietly rewrites a label to make it fit has moved the problem rather than solved it. Here the labels are rendered as entered; the only shortening is where a geometry physically cannot hold the text — Venn set labels past 16 characters, ring labels past 18, compact graph text between 19 and 30 — and every one of those limits is stated in the table rather than applied out of sight.
- You have to be able to take the file. A diagram that only exists inside the tool becomes a screenshot in someone's deck. Taking the file away is the point of the exercise, so an attributed HTML or SVG download is free and anonymous here alongside the preview; clean HTML without attribution and the PNG, PDF and PPTX exports sit behind a Prism trial or plan, and a diagram saved to your account downloads in every format either way.
What it is not, said plainly so you do not find out after typing a list: this draws business structure, not schemas or infrastructure. There is no entity-relationship diagram here — no tables, keys or cardinality — and no network topology, no routers, subnets or racks. The graph shape draws labelled nodes and typed relationships between them, which is a different thing from either. Decision flows and swimlanes are also elsewhere: those live in the flowchart maker.
Which diagram shape should you use?
Every shape takes the same input — an ordered list of labels, each with an optional one-line detail. Some shapes read an extra field; Venn and concentric layouts limit the items drawn, while matrices stack items in each quadrant.
| Shape | What it renders | Extra input it reads | Items drawn |
|---|---|---|---|
| Process / steps | Left-to-right sequence with arrows between stages | None | All steps, up to 200 |
| Cycle / loop | Closed loop that returns to the first stage | None | All steps, up to 200 |
| Pyramid | Stacked bands narrowing toward the top; first item is the apex | None | All steps, up to 200 |
| Funnel | Stacked bands narrowing toward the bottom; first item is the widest | None | All steps, up to 200 |
| Tree / hierarchy | Parent-child hierarchy drawn from an indent level per row | Level, 0–4 | All steps, up to 200 |
| Pillars | Equal-width columns side by side | None | All steps, up to 200 |
| Matrix (2×2) | Four labelled quadrants with axis titles | Quadrant per row, plus X and Y axis labels | All rows, up to 200; multiple items in the same quadrant are stacked, and unassigned items are named in a placement note |
| Venn (overlap) | Overlapping sets with a shared centre; set labels are shortened past 16 characters to fit the circles | None | First 3 items; any others are named in a note under the diagram |
| Concentric rings | Nested rings from a core outward; ring labels are shortened past 18 characters | None | First 4 items |
| Layered stack | Equal-width horizontal bands, top to bottom | None | All steps, up to 200 |
| Graph | Directed nodes with branching, merging, cross-links, cycles, typed business relationships, confidence, criticality, and accessible relationship summaries; compact node and edge text is shortened at 19–30 characters | A stable key per node plus explicit from/to connections | Up to 80 labelled nodes and 160 connections |
How to make a diagram, step by step
- Pick a shape. Choose one of the 14 geometries above, or load one of the 3 starter templates (portfolio matrix, value chain, capability pyramid) to see the input shape.
- Enter your labels. Type them into the numbered rows, or open Paste a list and paste one item per line, using
Label | Detailto split a heading from its one-line detail. - Fill in the shape-specific field. A 2×2 matrix needs a quadrant per row plus the two axis titles; a tree needs a level from 0 to 4 per row; a graph needs unique node keys and explicit connections. Every other shape needs nothing extra.
- Choose a theme. Bold is the default look; choose Conservative for a warmer palette. A saved Brand Kit applies your colors to either look. Open Brand colors to enter HEX values and use the color pickers.
- Render it. Press Make diagram. The render runs in-process without an AI call. Prism lays out accepted labels in the supported geometry; review any wrapping or shortening, text fit and connector routing in the result.
- Take the file. Download an HTML or SVG copy free, with a visible Gixo Prism attribution. A trial or plan removes the attribution and adds PNG, PDF, and PPTX.
Diagram maker FAQ
More Prism tools: Chart maker · Flowchart maker · Stat & quote cards · All of Gixo Prism →