AI infographic generator for your content
Infographics are part of Gixo Prism. Start with a draft or import source material,
then turn it into timelines, comparisons, stats grids, and process flows.
Infographic generations are included during your free 14-day trial, so you can try it without a card. After the trial, generation and clean, watermark-free export are part of a paid Gixo Prism plan.
13 structured modules. 16 themes. Canonical, feed, and story exports.
Start with the source, not a blank canvas
Paste notes, use an existing draft, or import source material. Prism identifies the facts, statistics, sequence, and comparisons that deserve visual treatment, then assembles them into a structured infographic you can review module by module.
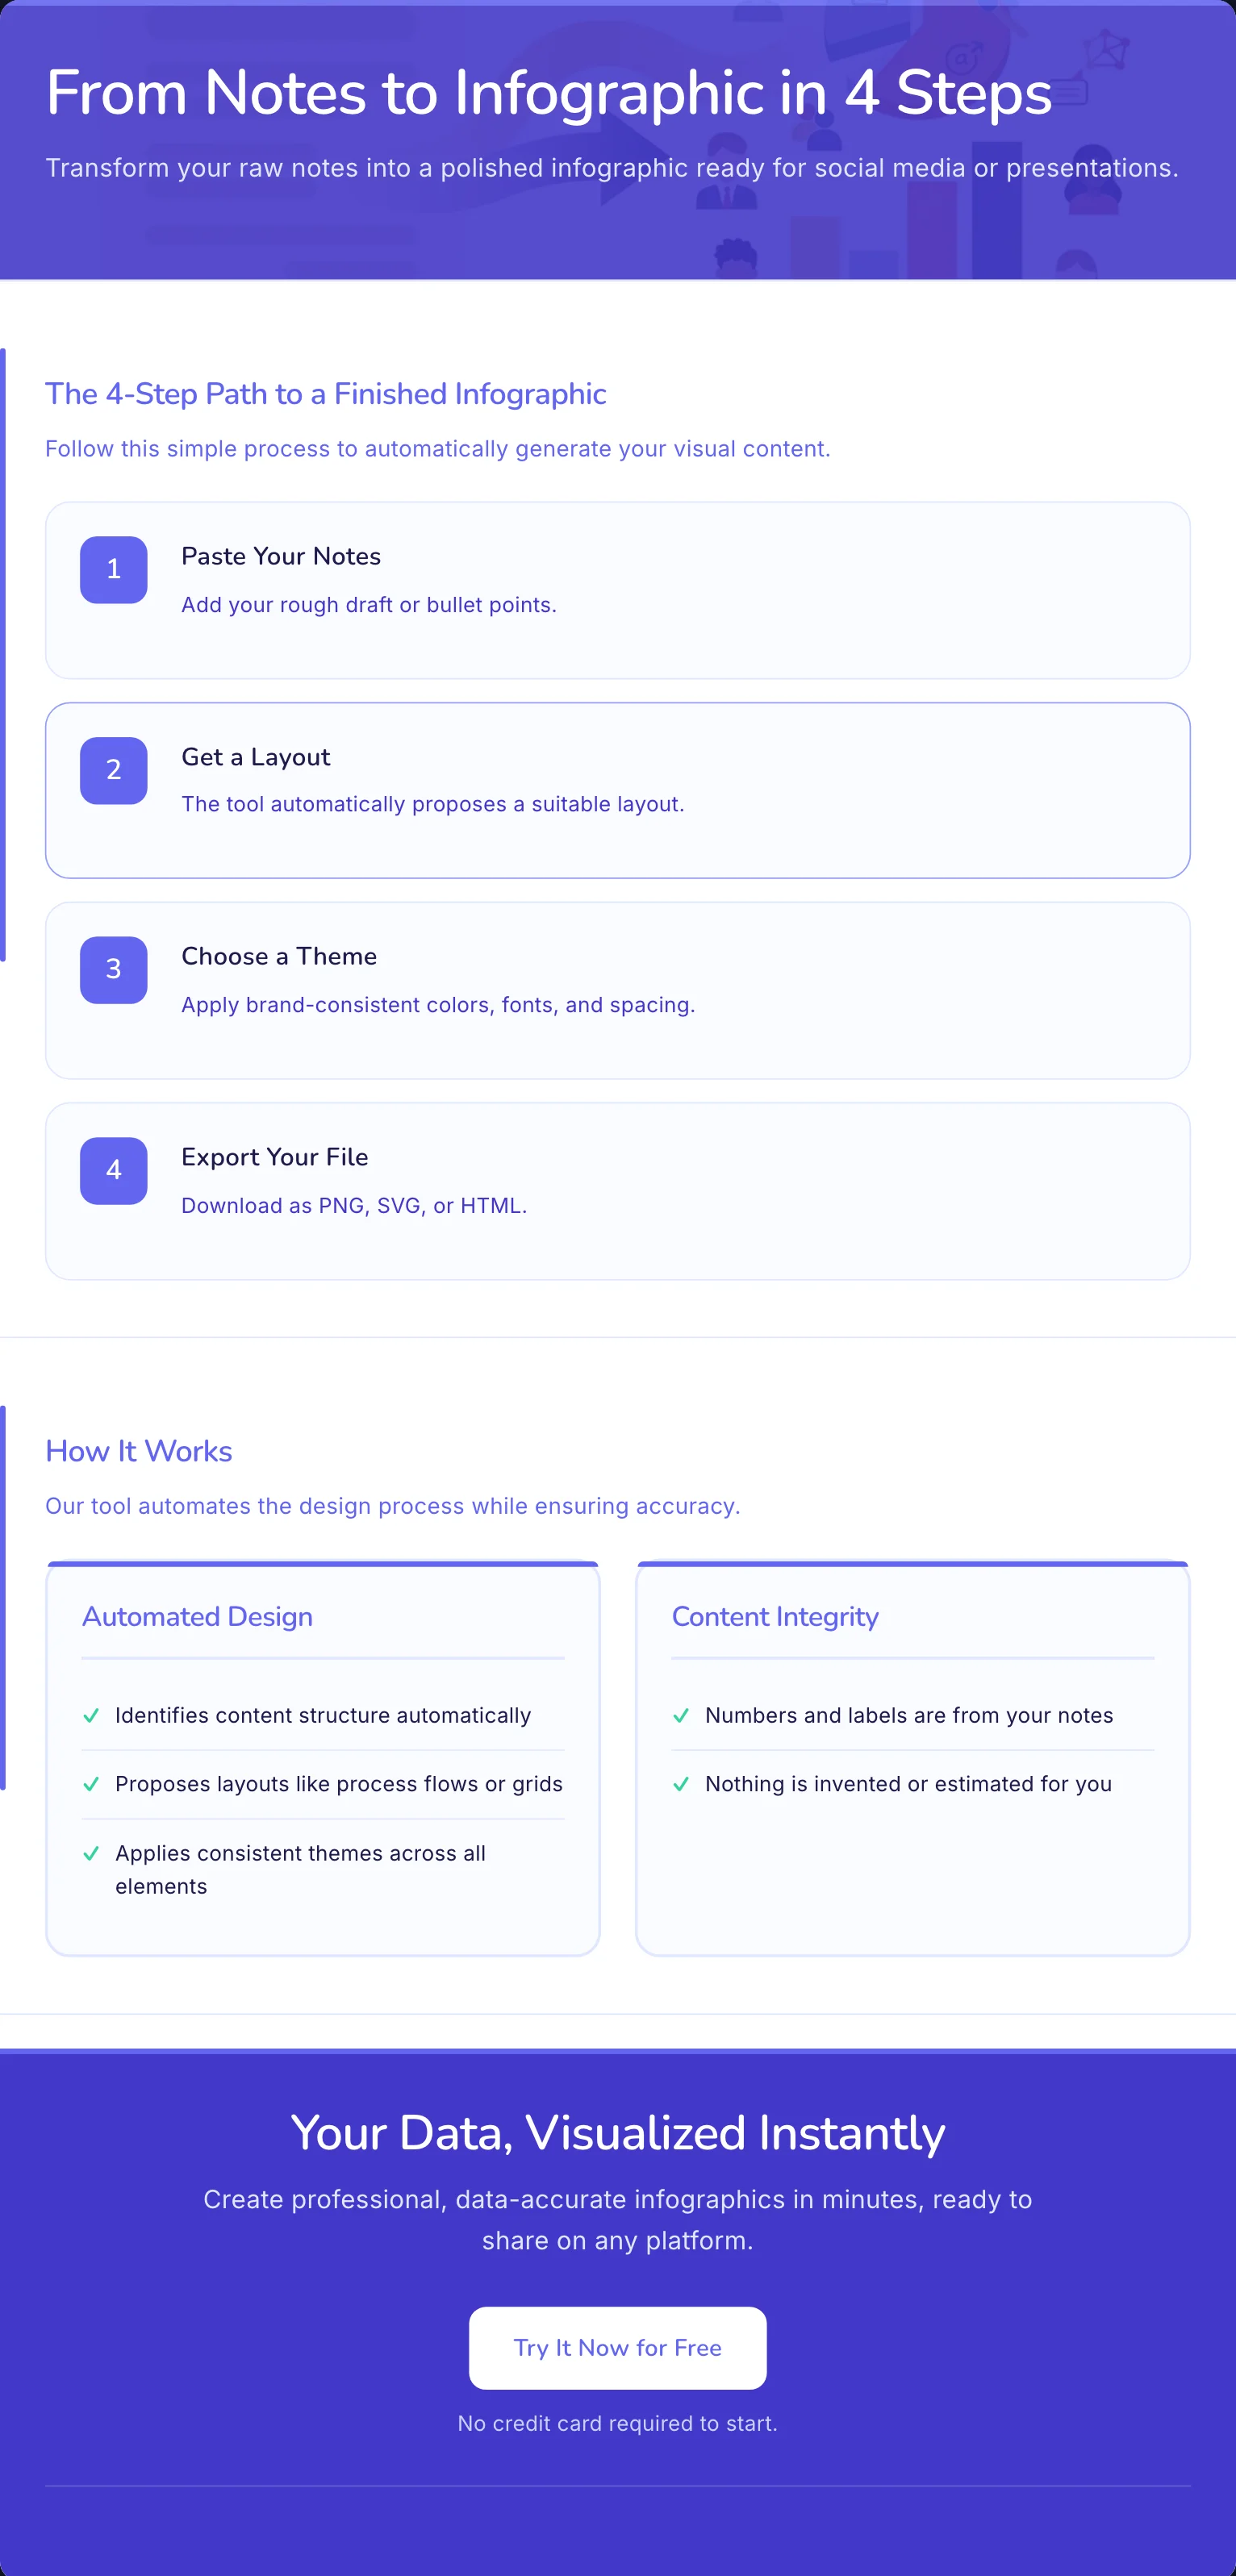
1. Ground it
Bring the topic, draft, notes, or imported source that the visual must represent.
2. Structure it
Prism selects from 13 modules for timelines, comparisons, maps, charts, evidence, and narrative flow.
3. Review it
Edit the copy, facts, order, theme, and module choices before exporting the finished artifact.
Structured for Clarity, Designed for Impact
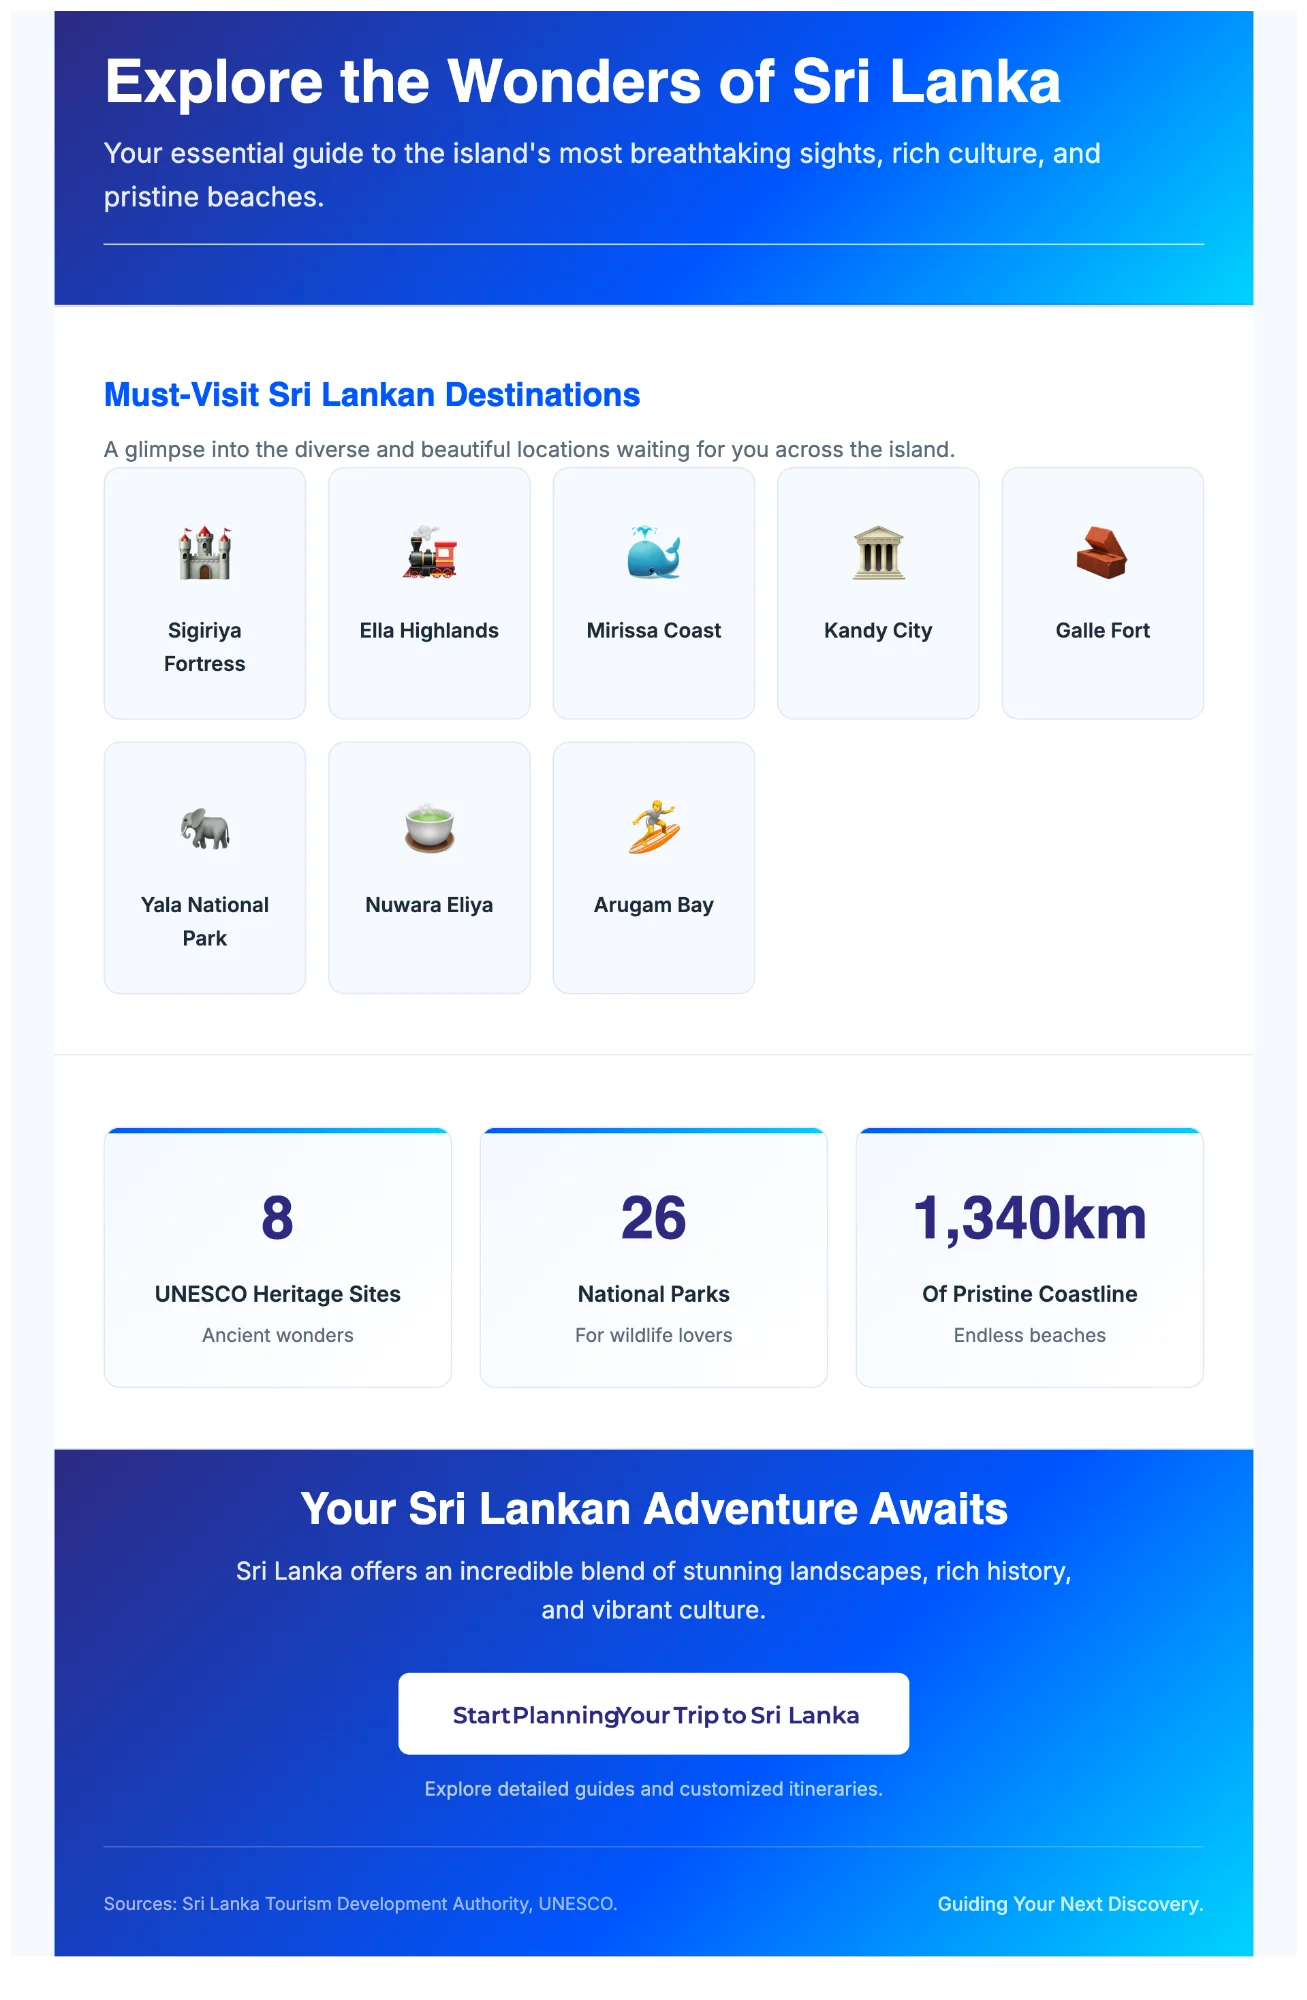
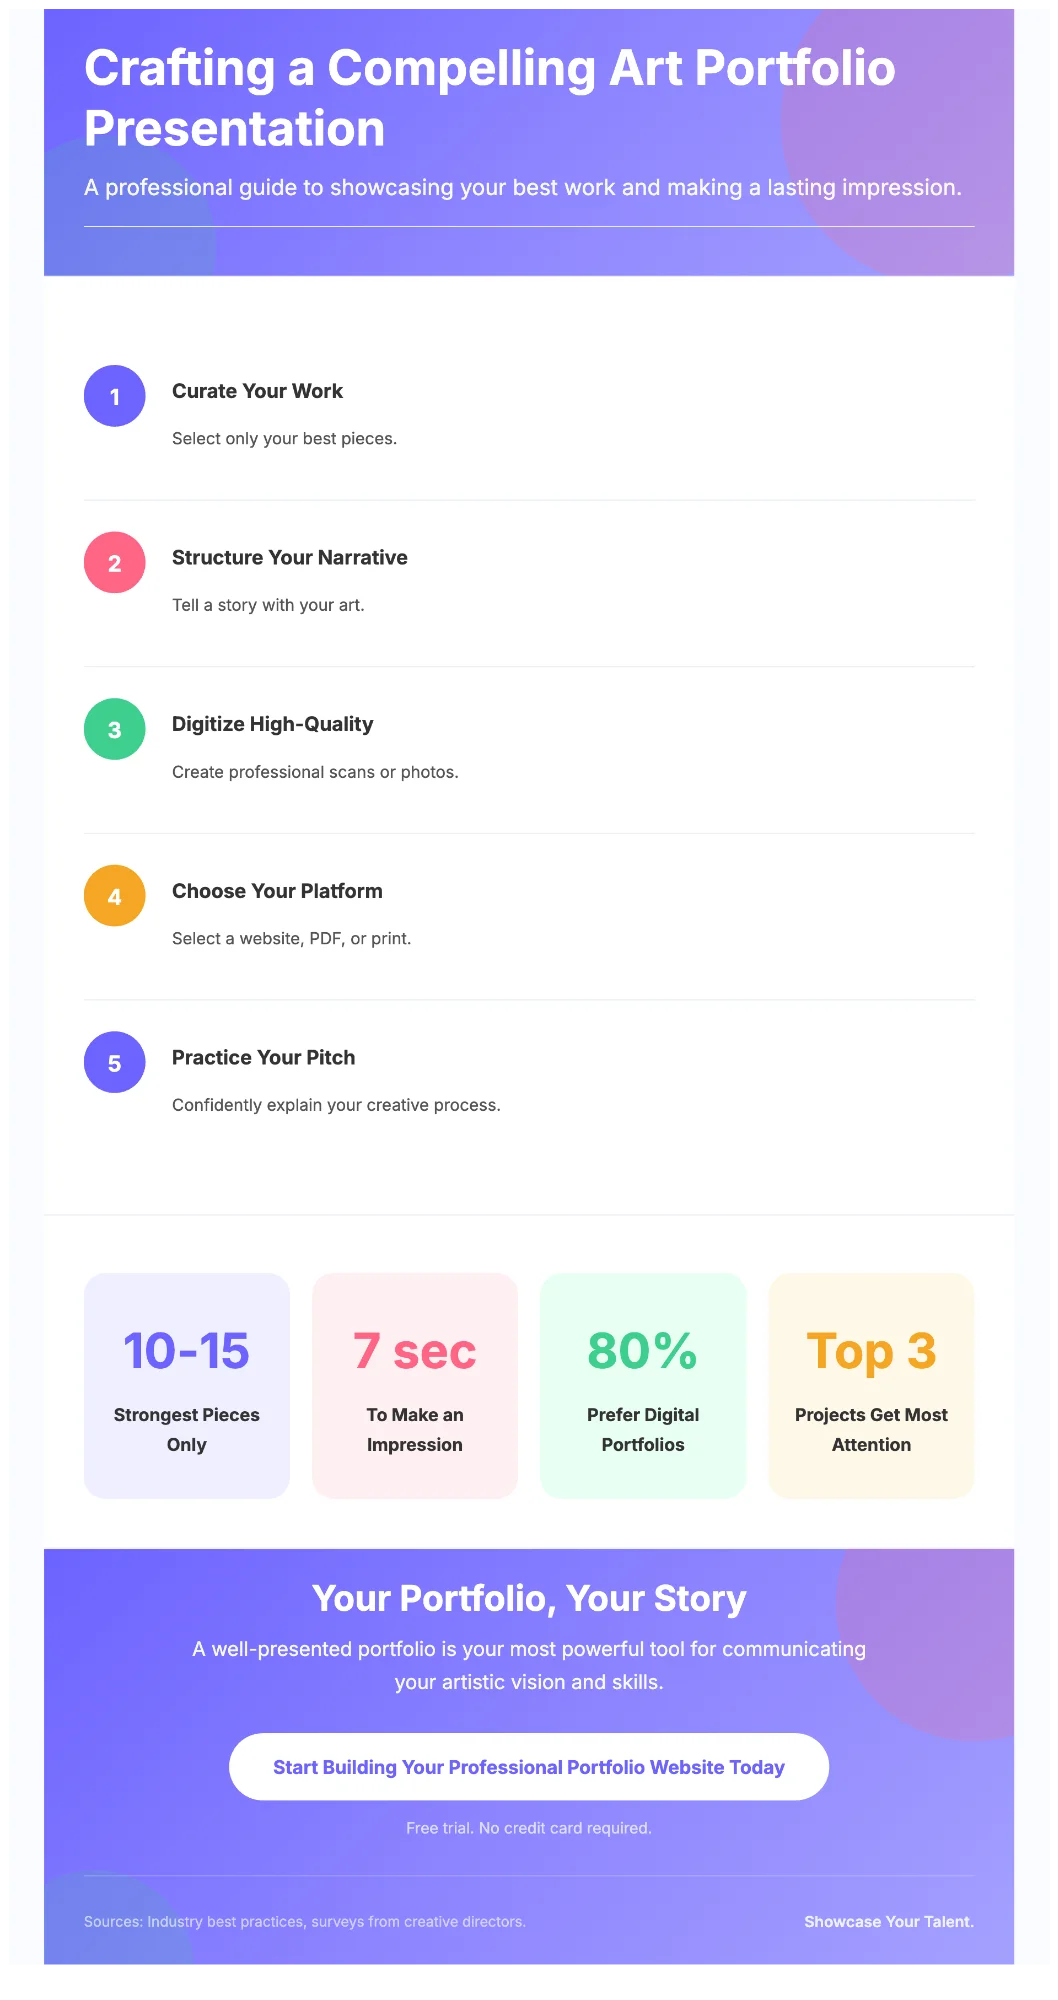
Every infographic is composed of modular layouts — timelines, stats, comparisons, and more.
13 Structured Modules
Prism can compose 13 purpose-built modules. These are 13 of the most familiar building blocks.
Built for Storytelling
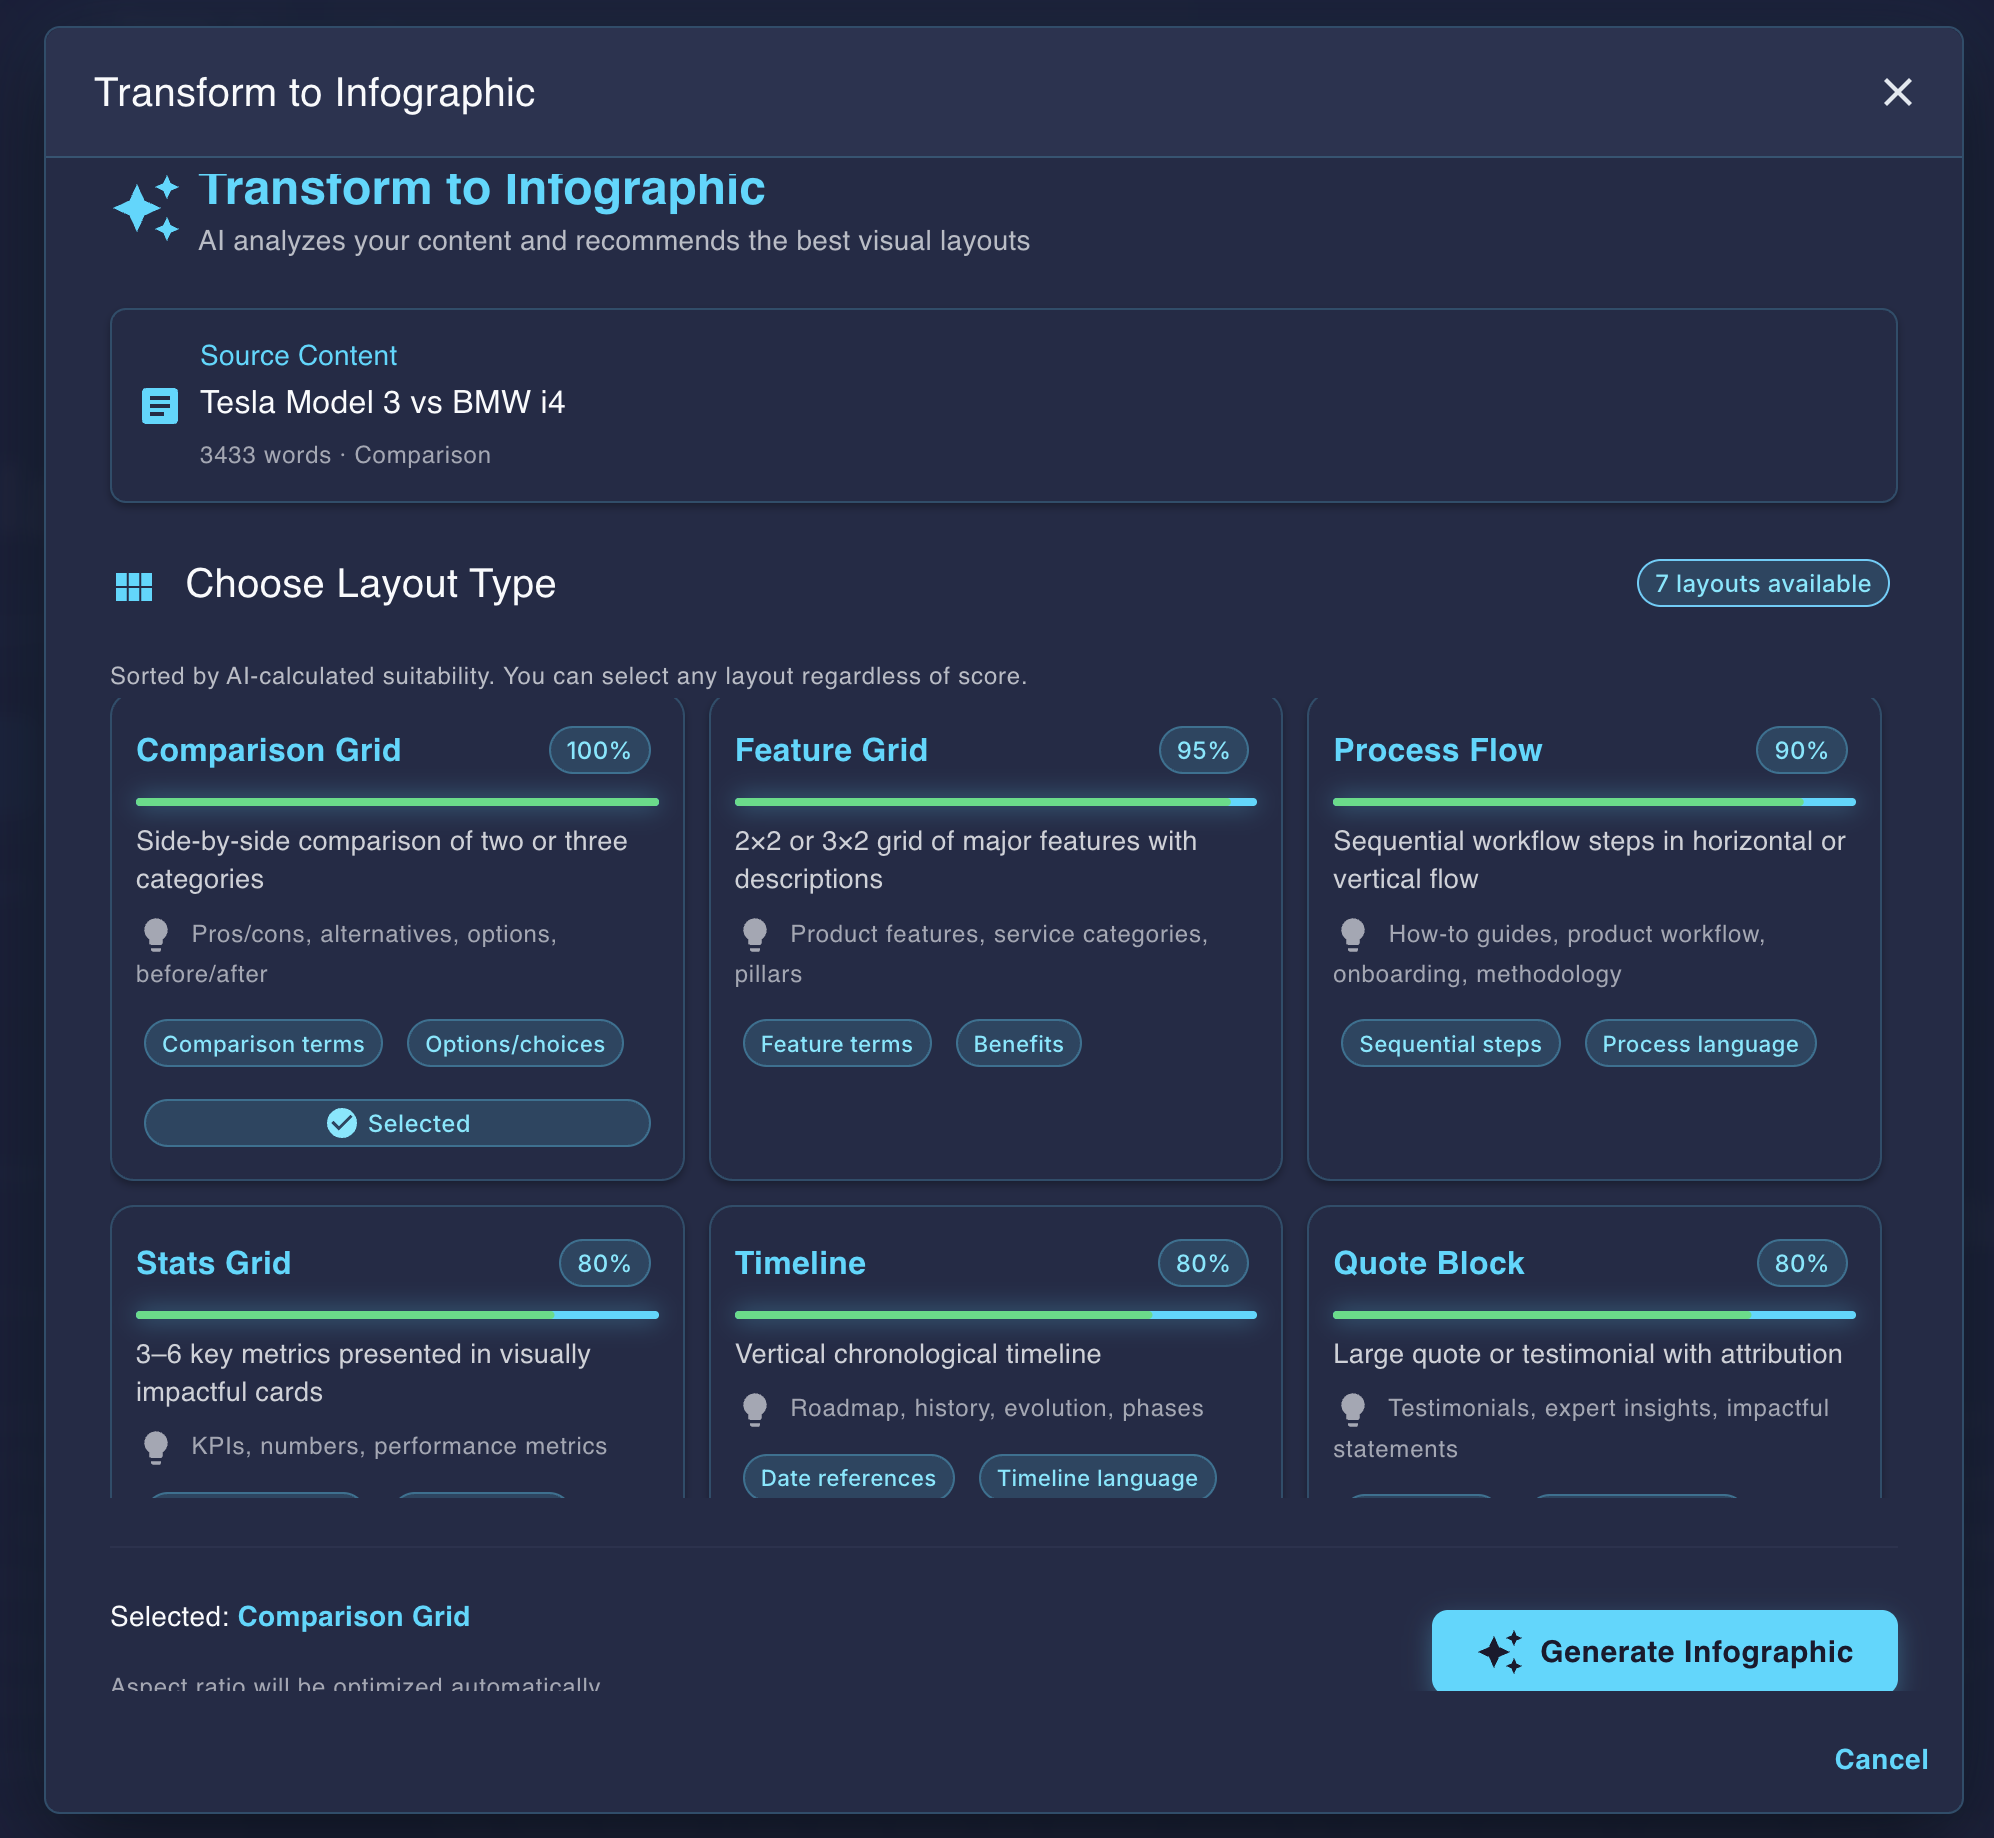
AI-powered layout selection ensures your data is presented with maximum clarity and visual impact.
AI Layout Analysis
AI analyzes your content structure and recommends the best combination of modules with suitability scores.
16 Professional Themes
From minimal white to tech neon, every theme is designed with consistent typography and color palettes.
Multi-Surface Export
Create the canonical infographic, feed 4:5 and story 9:16 PNGs, or export self-contained HTML.
Modular Composition
Each infographic is composed of stacked modules: hero, stats, timelines, comparisons, and more.
Instant Generation
Transform any content into a professional infographic in seconds with no design tools required.
Data-Driven Design
Stats grids, charts, timelines, and comparisons are styled automatically for clarity and impact.
16 Professional Themes
Every theme includes consistent typography, color schemes, and spacing rules.
Export for the surface where it will be used
Download the canonical infographic as PNG, export self-contained HTML, or produce feed 4:5 and story 9:16 PNG variants. Export both social sizes together as a ZIP when the same story needs to travel.
Build your first infographic with Gixo Prism
The infographic creator lives inside Gixo Prism. Review the plan, then build the first one in minutes.
Infographics are one surface of Gixo Prism — exact, on-brand visuals from your data. See charts, diagrams & flowcharts →